![]()
![]()
![]()
![]()
![]()
![]()
Social Security If You Are Dead
George H. Blackford © 4/7/2013
I recently received an email that began with the question: “WHO GETS YOUR SOCIAL SECURITY IF YOU ARE DEAD?” I found this question to be somewhat puzzling since the obvious answer is my spouse and dependent children. The email went on to declare that
THE ONLY THING WRONG WITH THIS CALCULATION IS THEY FORGOT TO FIGURE IN THE PEOPLE WHO DIED BEFORE THEY COLLECTED THEIR SOCIAL SECURITY!!!! WHERE DID THAT MONEY GO?????????????
This is another example of what one Presidential candidate called "TREASON in high places" !!! Remember, not only did you contribute to Social Security but your employer did too. It totaled 15% of your income before taxes.
If you averaged only $30K over your working life, that's close to $220,500. If you calculate the future value of $4,500 per year (yours & your employer's contribution) at a simple 5% (less than what the govt. pays on the money that it borrows), after 49 years of working you'd have $892,919.98.
If you took out only 3% per year, you'd receive $26,787.60 per year and it would last better than 30 years (until you're 95 if you retire at age 65) and that's with no interest paid on that final amount on deposit! If you bought an annuity and it paid 4% per year, you'd have a lifetime income of $2,976.40 per month. The folks in Washington have pulled off a bigger Ponzi scheme than Bernie Madhoff ever had.
Entitlement nothing!! I paid cash for my social security insurance!!!! Just because they borrowed the money, doesn't make my benefits some kind of charity or handout!!
We're "broke" and can't help our own Seniors, Veterans, Orphans, Homeless In the last months we have provided aid to Haiti, Chile , and Turkey . And now Pakistan ......home of bin Laden. Literally, BILLIONS of DOLLARS!!!
Our retired seniors living on a 'fixed income' receive no aid nor do they get any breaks while our government pours Hundreds of Billions of $$$$$$'s and Tons of Food to Foreign Countries!
They call Social Security and Medicare an entitlement even though most of us have been paying for it all our working lives and now when it's time for us to collect, the government is running out of money. Why did the government borrow from it in the first place? Imagine if the *GOVERNMENT* gave 'US' the same support they give to other countries. Sad isn't it?
This email is truly bizarre! In addition to the denial of the survivors benefits provided by Social Security, that $892,919.98 number makes it sound like anyone with an average income of $30K could have become rich by the time they retired if they had just been allowed to save and invest their payroll taxes. This just isn't true.
Looking at the Numbers
To begin with, there are income caps on payroll taxes, above which you don’t have to pay the tax. If you are ready to retire on January 1, 2013 at age 65 after having worked 49 years you would have had to start working in 1964. The payroll cap in 1964 was $4,800, and it had only increased to $25,000 by 1980 (It is at $113,700 today). In addition, payroll taxes were much lower in the 1960s and 1970s when Social Security was on a pay-as-you-go basis. They were 7.25% in 1964 and gradually increased to 12.26% by 1980. The pay-as-you-go system was changed in the 1980s when the Greenspan Commission led to a partial-advanced-funding system, but it wasn’t until 1990 that the payroll tax had increased to its present level of 15.3%.
What this means is that the maximum you could have accumulated if you had invested your payroll taxes in an alternate investment at 5% would have been $810,953, but in order to have done that you would have to have had an average income of at least $48,831 over that 49 year period (and an income of at least $106,000 in 2012), not the $30K average this email assumes, and the amount of taxes you would have ended up paying into the system would have been $353,667, not the $220,500 assumed in this email.
At the same time, the average income for all people over that period was only $26,598, which is a long way from the $46,682 needed to come near the $892,919.98 this email promises, and even if you had been able to earn that kind of money for the entire 49 years you were employed you would have no health insurance when you retired, which would be just fine if you are healthy, but not so good if you aren’t, and you would also have to thank your lucky stars you made it to 65 and were able to save all that money.
When we leave the make-believe world of this email we find that the payroll taxes we all pay today are broken down as follows:
Table 1: Breakdown of Payroll Tax, 2013
Program
OASI
DI
HI
Total
Employees
5.3%
0.9%
1.45%
7.65%
Employers
5.3%
0.9%
1.45%
7.65%
Total
10.6%
1.8%
2.9%
15.3%
From the Social Security Administration’s Tax Rates as a Percent of Taxable Earnings Table.
where OASI is the portion of the payroll tax that funds the Social Security Old Age and Survivors Insurance program; DI is the portion that funds the Social Security Disability Insurance program, and HI is the portion that funds Part-A of the Social Security Medicare program. Only the 10.6% tax rate that funds the OASI program is relevant to the question, ”Who gets Social Security if you are dead?”, not the total payroll tax rate of 15.3% which funds the DI and HI programs as well as OASI.
While hindsight is 20/20 for those who make it to 65 (66 in today’s world if you want to obtain full benefits), you could have died or become disabled along the way, in which case there would have been much less available to support you or your dependents. If you had died or become disabled after 10 years of employment, for example, only $8,616 would have accumulated in your retirement account, and after 20 years there would have been only $48,330 to get you or your dependents through the rest of your or their lives. After 30 years you would have been in your mid to late 40s with only $167,404 in your nest egg, and after 40 years you would be in your mid to late 50s with only $412,075 and no prospect for health insurance when you reached 65 if you were to become ill.
It may seem like quite an accomplishment to have accumulated $412,075 by your mid to late 50s, but it is worth thinking about the way you managed to accumulate it. The only way to be certain of actually accumulating this much money under this scheme is to have invested every cent of your payroll taxes in financial assets—such as savings accounts, certificates of deposit, or Treasury securities—that were guaranteed by the federal government. Without a government guarantee, there would be no way you could have been certain of not falling prey to a Bernie Madoff-type schemer or of not becoming a casualty of some bankrupt institution in which you had invested your hard earned funds only to wake up one day in your 40s or 50s to find that the nest egg you had been counting on was gone. Nor could you be certain you would be able to hang on to that nest egg as you tried to live off of it for the rest of your life in the absence of a guarantee by the federal government.
Without that government guarantee, it wouldn’t have taken much for you to have ended up destitute and on the public dole if you had stumbled along the way in trying to accumulate that $892,919.98. That is exactly what happened to working people who fell on hard times before Social Security, and that’s why the Social Security system was created in the first place: to keep working people and their dependents from becoming destitute and off the public dole if, for whatever reason, they fell on hard times and were unable to save enough to accumulate that $892,919.98 on an average income of $30K or less over the course of 49 years of gainful employment.
Getting Your Money Back
What if you earned more than the income caps over the 49-year period under consideration but only paid for Social Security’s disability (DI) and hospital insurance (HI) and, instead, invested only the retirement portion of your payroll taxes in an alternative 5% investment scheme rather than all of your payroll taxes? In this situation you would have ended up with a retirement nest egg of just $580,672 when you retired at age 65 after investing at 5% the $249,256 of OASI taxes you had avoided. At the same time, you would be faced with a 17.19 year life expectancy if you are a man and a 19.89 year life expectancy if you are a woman. You also would have forgone a Social Security retirement benefit equal to $2,349/mo. ($28,188/yr.) if you are unmarried, and an additional spousal benefit equal to $1,258/mo. ($14,094/yr.) if you are married and your spouse qualifies for the full spousal benefit.
What this means is that if you had stayed with the Social Security System you would have been able to get back your original $249,256 in OASI taxes in just 107 months ($249,256/$2,349/mo = 107 months which is 8.8 years) of retirement if you are single, and in just 70 months ($249,256/$3,607/mo= 70 months which is 5.8 years) if you are married and are able to take full advantage of the spousal benefit. In fact, it would take only 151 ($353,667/$2,349/mo = 151 months which is 12.6 years) to get back, in retirement benefits alone, the entire $353,667 you would have paid in payroll taxes for OASI, DI, and HI combined if you had stayed with the Social Security System even if you are not married.
If all you care about is getting your money back, you can skip the rest of this section and go on to the next. If you also care about getting your money back with interest, the relevant comparison here is between the discounted present value of the income stream your OASI benefits can be expected to generate over time relative to the hypothetical value of the nest egg you supposedly could have accumulated if you had chosen an alternative 5% investment. (If you are not familiar with the concept of present value there is a fairly readable explanation of this concept in Wikipedia.) The discounted present value of your expected OASI income stream tells you what that income stream is worth today, and once you have an estimate of what it is worth today, you can use that estimate to judge whether these benefits are worth more or less than the value of the $580,672 nest egg you supposedly could have accumulated by the time you retired if you had chosen an alternative 5% investment.
When we calculate the present value of the OASI benefits over the 17.19 and 19.89 years of life expectancy for men and women at age 65, discounted at the arbitrarily chosen 5% rate of interest the email assumes you could earn on an alternative investment, we find that this value is $325,725 for men, $355,673 for women, and $518,536 for a married couple that is able to take full advantage of the spousal benefit. In comparing these numbers with your hypothetical $580,672 nest egg we find that the OASI benefits seem to fall short for single men and women while those of the married couple are at least comparable to that of your hypothetical alternative investment. There are, however, two factors that must be considered in making this judgment.
First, the present value of your OASI benefits depends crucially on the rate of interest chosen to discount these benefits. The appropriate rate to use begins with the rate of return that can actually be earned on the $580,672 nest egg that is your alternative investment. When we look around the world today we find that there is very little chance of being able to earn a 5% return on a safe investment. The rates on Treasury securities today (February 16, 2013) are far from 5%. Even the rate on 30 year government bonds is barely over 3%, and anything under 7 years is less than 1%. This means that it is very unreasonable to assume you would be able to earn a 5% rate of return on your $580,672 nest egg if you had gone the alternative route and were trying to find a safe way to invest it today.
Second, the fact that OASI benefits are indexed to the rate of inflation means that you also earn a rate of return on your OASI benefits equal to the rate at which these benefits are adjusted for inflation over time. As a result, the appropriate discount rate to use in estimating the present value of your OASI benefits is the rate of return you expect to be able to earn on your alternative investment less the rate at which you expect your OASI benefits to be adjusted for inflation over the next 17.19 and 19.89 years.
If, for example, you think you would be able to earn a 3% rate of return on your $580,672 alternative investment and, at the same time, think it is reasonable to expect the rate of inflation over the next 20 or so years to increase your OASI benefits somewhere in the neighborhood of 2%/year, the appropriate discount rate in determining the present value of your OASI benefits would be 1%, that is, the expected rate of return less the expected rate of adjustment for inflation.
When we use the more appropriate discount rate of 1% in calculating the present value of your forgone OASI benefits, rather than the arbitrarily chosen 5%, we find that the present value these benefits is $444,839 for single men, $507,344 for single women, and $729,763 for a married couple that is able to take full advantage of the spousal benefit. In comparing these numbers with your hypothetical $580,672 nest egg we find not only that the OASI benefits for the married couple is worth substantially more than the alternative nest egg, even the benefits for single men and women are comparable to that of the hypothetical alternative investment. In fact, the present value of OASI benefits if you are married is comparable to the $810,953 you could have earned if all of your payroll taxes were invested at 5% in an alternative investment, and you wouldn’t have had to forgo the benefits of Social Security’s Disability Insurance and Medicare in this situation.
It should be clear by now that there are two facts that are exceedingly relevant to the process of evaluating the worth of these two alternatives: 1) Social Security benefits come with a federal government guarantee, and the only way you can get a comparable guarantee in an alternative investment is if you invest in financial assets that also have a federal government guarantee, and 2) present value analysis is terribly subjective in that it depends on what you think is going to happen in the future. In other words, there is a great deal of uncertainty involved in these kinds of calculations. This should be clear from the above discussion and from Table 2 which shows the kinds of results you come up with as you try to decide on the rate of return on an alternative investment and the rate at which benefits will be adjusted for inflation in evaluating the worth of your Social Security benefits.
Table 2: Present Value of Maximum OASI Benefits at Age 65.
Recipient
Monthly
Benefit
Life Expectancy
Years
Discount Rate
7%
5%
3%
1%
0%
-1%
(Thousands of Dollars)
Single Male
$2,349
17.19
$283
$326
$379
$445
$484
$528
Single Female
$2,349
19.89
$304
$356
$422
$507
$559
$618
Married Couple
$3523
17.19/19.89
$445
$519
$611
$730
$801
$882
From the Social Security Administration’s Actuarial Life Table and Detailed Benefit Calculator.
I would note that the negative discount rate possibility in Table 2 is not beyond the realm of reason in today's world. When I look at the Daily Treasury Real Yield Curve Rates today (3/1/13) I find that the 5 year rate is -1.45% and the 30 year rate is only 0.52%.
It should also be noted that these kinds of calculations are exceedingly easy for just about anyone to make who is willing to take the time to do so. The Social Security Administration makes available a Detailed Calculator that will calculate the taxes and benefits associated with any income history for you, and you can download this Detailed Calculator for free from their website by clicking on this link. In addition, I have stored an Excel spreadsheet on my website at www.rwEconomics.com that will calculate the accumulated values of those taxes at alternative interest rates along with the present values at alternative discount rates of Social Security’s benefits for single individuals and married couples. This spreadsheet will also do the calculations for you, and you can download this spreadsheet for free by clicking on this link.
Social Security and Insurance
One of the most insidious things about the email being examined here is the way it obscures the insurance nature of Social Security and our other social-insurance programs. Of course there are countless ways to think up hypothetical scenarios in which people lose from participating in the Social Security System—such as if someone dies with no dependents just before retirement or if, as in this email, a single person with no dependents makes it to retirement with a small fortune intact—but all of these scenarios miss the point. It is also possible for those of us who have made it through life without a serious illness, automobile accident, or having our house burn down to make similar calculations with regard to the terrible price we have paid for health, automobile, and fire insurance. Social Security is an insurance program, not an investment program, and just like any other insurance program, there is no reason to hope to make a profit from it.
Those who don't benefit from fire insurance because their houses don't burn down end up paying for those who do 'benefit' because their houses do burn down, and, in general, there are administrative costs associated with insurance that create a net loss for the group of insured as a whole. The point of insurance is to provide protection against the possibility of catastrophic loss by spreading the risk among the insured. Insurance makes it possible to trade the uncertainty associated with the possibility of a catastrophic loss for the certainty of a smaller loss associated with the cost of the insurance. That's the way insurance works, and it is because people want to protect themselves from catastrophic loss that insurance exists in the first place in spite of the fact that, in general, the insured as a whole suffer a net loss.
Most people begin their working lives with high hopes for the future. They don't pay into the Social Security System because they hope to benefit from it by becoming disabled at an early age, or ill and unable to obtain health insurance when they reach the age of 65, or destitute when they reach an age where they are forced into retirement, or die so their dependents can collect their survivors benefits any more than they insure a new car because they plan to wreck it or insure a new house because they plan to burn it down. They plan to make a fortune by the time they retire and live to a ripe old age beyond retirement, but, at the same time, they know that much of life depends on the luck of the draw, and it is better to pay the price of social insurance than risk having to suffer the consequences of not having it in the event of a catastrophe that may or may not occur 10, 20, or 30 years down the road.
Social Security and Entitlements
Just as insidious as the way in which this email obscures the insurance nature of Social Security and our other social-insurance programs is the way it misinforms people about the relationship between entitlement and welfare programs: “Entitlement nothing!! I paid cash for my social security insurance!!!! Just because they borrowed the money, doesn't make my benefits some kind of charity or handout!!”
An entitlement program is, by definition, any program that guarantees, by law, benefits to people who meet the specific requirements of the programs. Social Security is obviously an entitlement program since its benefits are guaranteed by law to anyone who meets the criteria for this program. The same is true of Medicare. In fact, Social Security and Medicare are the largest entitlement programs in the federal budget. At the same time, these programs are not considered to be welfare since they are not means tested, that is, their benefits are available to all who qualify irrespective of their income or wealth. You are entitled to the benefits of Social Security and Medicare whether you are wealthy or poor, so long as you meet the requirements of these programs. This fact makes Social Security and Medicare entitlement programs, and the fact they are entitlement programs does not make them welfare programs. There are innumerable federal entitlement programs—the benefits of which are available to all who qualify irrespective of income or wealth—that have nothing to do with welfare.
The confusion between entitlements and welfare, and the insistence that Social Security and Medicare are not entitlement programs—even though they are entitlement programs—may seem like a rather minor thing, but it’s not. Unless you know that Social Security and Medicare are entitlements you don’t have a clue as to what’s going on in Washington today. Today's debate over entitlement spending, budget deficits, and the national debt is not about welfare, and it most certainly has nothing to do with the extravagance of our foreign aid programs as the propagandist who wrote the above email would have you believe. The debate is about Social Security, our healthcare entitlement programs—specifically, Medicare and, to a lesser extent, Medicaid which takes up half the space in the federal budget that Medicare takes up—and the taxes needed to keep these programs viable. You simply can not understand this fact if you do not know that Social Security and Medicare are entitlements.
The professional budget hawks who only care about cutting taxes and don’t care at all about Social Security and Medicare are more than happy to have people confuse welfare with entitlements because the Social Security and Medicare entitlements dwarf all other entitlements in the federal budget. There is no way to justify cutting taxes without significant cuts in entitlement spending, and there is no way to make significant cuts in entitlement spending without cutting Social Security, Medicare, and Medicaid. That’s where the money is, and the more people rage against entitlement programs, thinking they are raging against welfare and not Social Security and Medicare, the better for those who only want to cut taxes and know they can only do this at the expense of Social Security and Medicare.
Social Security, Medicare, and Welfare
That this debate is, in fact, about Social Security, healthcare entitlements, and the taxes necessary to keep these programs viable should become obvious once you look at what has happened to Social Security, Medicare, Medicaid, welfare, and taxes over the past forty-five years.
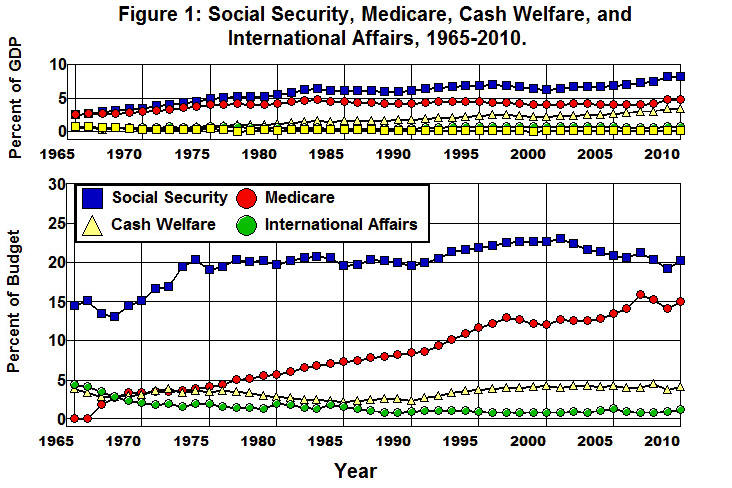
Figure 1 shows what Social Security, Medicare, and Cash Welfare expenditures looked like in the federal budget from 1965 through 2010, where Cash Welfare shows the total expenditures by the federal government on welfare programs such as Supplemental Security Income (SSI), Temporary Assistance to Needy Families (TANF), the Earned income tax credit (EITC), and the Child Tax Credit (CTC) that pay cash benefits to their beneficiaries. (Note that Cash Welfare excludes expenditures on those welfare programs, such as Supplemental Nutrition Assistance Program (SNAP or Food Stamps) and Medicaid, that provide in-kind benefits—food in the case of SNAP and medical services in the case of Medicaid.) I have also added International Affairs to this graph as well because when I look at International Affairs within this context I do, indeed, find it difficult to imagine what it would be like “if the *GOVERNMENT* gave 'US' the same support they give to other countries.”
Source: Understanding The Federal Budget.
The expenditures in this figure are plotted as a percent of GDP (Gross Domestic Product) because GDP is the gross income produced in the economy. It is the base upon which the taxes that must be collected to pay for government expenditures depends, and, as such, the ratio of government expenditures to GDP measures our ability to pay for these expenditures.
The first thing that should be obvious from this graph is that when people complain about out-of-control entitlement spending it makes no sense at all to think in terms of our Cash Welfare entitlement programs SSI, TANF, EITC, and CTC. Expenditures on these programs as a fraction of the budget and of GDP have barely changed since 1995 and are about the same today as they were in 1976. It’s our Social Security and Medicare entitlement programs that have increased dramatically since 1965, not our Cash Welfare programs.
The second thing that should be obvious is that, while there was a substantial increase in Social Security from 1965 through 1974, Social Security has been relatively stable since then. It’s Medicare that has shown a dramatic increase over the years, going from nonexistence in 1965 to some 15% of the budget in 2010.
It should also be obvious from this graph that government expenditures on Cash Welfare, and also on International Affairs ("our government pours Hundreds of Billions of $$$$$$'s and Tons of Food to Foreign Countries!"), are insignificant in the grand scheme of things when it comes to funding Social Security and Medicare. With approximately 1% of the budget and 0.26% of our gross income spent on our entire International Affairs budget there is hardly enough in the foreign aid portion of this budget to make a difference in anything, let alone Social Security and Medicare, and even the almost 5% of the federal budget and less than 1% of our gross income that goes to Cash Welfare is relatively insignificant when it comes to the 35% of the federal budget and 7% of gross income that Social Security + Medicare consumes.
It is important to note, however, that welfare is no longer insignificant when we add the non-cash welfare expenditures in the federal budget to the Cash Welfare expenditures plotted in Figure 1 and look at Total Welfare plotted in Figure 2.
Source: Understanding The Federal Budget.
Figure 2 shows the relationship between Social Security + Medicare and Total Welfare expenditures including both cash and non-cash expenditures whether they are entitlements or not. It also shows what welfare expenditures look like when we exclude Medicaid (Total Welfare – Medicaid) from the total as well as when we exclude Medicaid, Earned Income Tax Credit, Child Tax Credit, and all federal expenditures on Food and Nutrition assistance to lower income families and individuals (Welfare – Medicaid/Food/Tax Credits).
When we compare the curves in Figure 1 and Figure 2 we find that Total Welfare in the federal budget has, indeed, grown dramatically since 1965, increasing from 5% of the federal budget and less than 1% of GDP in 1965 to 15% of the federal budget and more than 3% of GDP today. At the same time, by comparing the Total Welfare – Medicaid and Welfare – Medicaid/Food/Tax Credits curves we can see what has caused Total Welfare to increase so dramatically, namely, the dramatic increase in Medicaid and a smaller, but rather significant increase in the Food/Tax Credit portion of the federal budget. As is shown quite clearly in Figure 2, there would have been virtually no change in welfare expenditures over the forty-five years covered by these graphs were it not for the increase in Medicaid/Food/Tax Credits.
The curves in these two figures clearly demonstrate how the increase in entitlement spending over the past forty-five years has been brought about through the dramatic increase in Medicare and Medicaid expenditures since the 1960s, combined with a significant increase in Social Security from 1965 through 1974, and a relatively minor increase in Food/Tax Credits since the 1960s. What this means is that there is no way to cut or control entitlement spending without cutting or controlling Social Security, Medicare, Medicaid, and, to a lesser extent, Food/Tax Credits.
It should also be noted that the kinds of data plotted in Figure 1 and Figure 2 and are exceedingly easy to come by. The Office of Management and Budget's official statistics in are provided for all to see in their Historical Tables and can be obtained by clicking on this link. In addition, I have provided a detailed explanation of the budget items that are included in these figures in Understanding The Federal Budget.
Social Security, Healthcare, and Taxes
By now it should be at least apparent that, in the end, the fundamental issue in the debate going on in Washington today comes down to Social Security, healthcare, and taxes: Are we going to collect the taxes needed to maintain Social Security, Medicare, and Medicaid, or are we going to not collect the taxes needed to maintain these programs and dismantle them in order to justify not raising taxes? This is what the debate over entitlement spending in Washington is about today. It’s not about foreign aid or welfare, and if you examine the curves in Figure 1 and Figure 2—and think about it—it should become obvious that it is not about foreign aid and that, except for Medicaid/Food/Tax Credits, it makes no sense at all to think this debate is about welfare.
And when it comes to Medicaid/Food/Tax Credits it is worth noting that the great bulk of the expenditures in these welfare programs go to either 1) indigent elderly or indigent disabled adults through our federal SSI, Medicaid, and Food and Nutrition programs or 2) poor children through our federal Food and Nutrition and Medicaid programs—not to working-age, able-bodied adults—and the vast majority of the beneficiaries of these programs would be in desperate straits without them. Not only are these programs the backbone of our social safety net, it is through these programs that we at least try to be a nation that does not allow people to suffer from malnutrition or starve for want of food or to suffer from illness or die for want of medical care. This is especially so when it comes to poor children and indigent elderly and indigent disabled adults. It is absolutely foolish to think we can be such a nation and, at the same time, save substantial amounts of money by cutting these programs, and it would be heartless and cruel to cut these programs in the face of this fact.
While the benefits from the EITC and CTC programs do go to working-age, able-bodied adults, these benefits are available only to the working poor. They are not available to those who do not have a job and do not work, and it is worth thinking about the history of these tax credits.
Back in the 1980s, the Reagan Tax Cuts to upper-income groups led to huge deficits in the federal budget that were not brought under control until the 1990s. One of the mechanisms used to bring these deficits under control, and to avoid having to rescind the Reagan Tax Cuts on the upper-income groups, was to increase the payroll taxes paid by working people. As a result, the Social Security System was converted from a pay-as-you-go system in which each generation paid the cost of supporting Social Security for their parents’ and grandparents’ generations to a partial-advanced-funding system in which the baby boomers were required to prepay a portion of their own Social Security benefits in addition to paying for those of their parents and grandparents.
As a result, there has been a surplus in the Social Security System since the mid 1980s that has led to a $3 trillion increase in the Social Security Administration’s trust funds. These trust funds were, in turn, lent to the federal government to help finance its general expenditures, to the effect that by 2001 the money borrowed from the Social Security System’s trust funds in that year alone amounted to 8.75% of the federal budget.
In the meantime, the increased payroll taxes on working people that helped to make it possible to eliminate the deficits in the late 1990s—the deficits that were created by the Reagan Tax Cuts—placed a particularly harsh burden on the lowest income groups within our society. This burden was partially alleviated by increasing the Earned Income Tax Credit during the 1990s and introducing the Child Tax Credit in 1997.
The problem is, as the baby boomers began to retire in the early 2000s, the amount of cash available to be borrowed from the Social Security System began to dwindle, and in 2010 there was no cash left to borrow even though the Social Security System still had a surplus in that year. The reason is that even though the interest the federal government owed the Social Security System for that year plus the amount of cash the system took in in payroll taxes exceed the total amount of cash the system paid our in benefits and administrative costs, the amount of cash the system took in from payroll taxes was less than the amount of cash paid out in benefits and costs. This meant that in 2010 the government could no longer simply credit the interest it owed the Social Security System to its account and borrow its surplus cash since there was no surplus cash left to borrow. In fact, there was a cash deficit in the Social Security systems accounts, and the federal government was forced to pay a portion of the interest it owed the system in cash in order to fund this cash deficit.
As a result, since 2010 the federal government has been forced to pay cash into the Social Security System from its general revenues to meet a portion of its interest obligations to the Social Security System. At the same time, the amount of money the federal government owes the Social Security trust funds continues to grow because the amount of cash the federal government has been forced to pay each year to meet its interest obligations is less than the total amount of interest that accrues each year on the debt the federal government owes to the system. The difference must be credited to the Social Security System's trust fund account.
This situation is expected to continue through 2022 when the Social Security System's cash deficit is expected to equal the amount of interest the government owes the system in that year. At that point the Social Security trust fund is expected to peak, and from then on this trust fund is expected to fall as the federal government is forced to begin redeeming the government bonds in the Social Security trust fund (as well as pay the interest that accrues each year on its remaining debt to the Social Security trust fund) in order to meet its obligation to make benefit payments to the baby boomers.
There are only two ways the federal government can come up with the cash needed to pay the interest on its debt to the Social Security System and to begin paying back the principal it borrowed from working people: It can either raise taxes or borrow the needed funds. If it doesn’t raise taxes, it will have to borrow, and it can’t borrow without increasing the national debt. The only alternative is for the federal government to default on its obligations to the baby boomers by reducing their Social Security benefits, and that's exactly where the sticking point is in Washington today—whether or not, and by how much to cut benefits!
In light of this history, combined with the fact that the tax breaks given to the lower income groups in our society pale in comparison to those given to the middle and upper income groups, it is rather difficult to argue that the Earned Income and Child Tax Credits that have been a godsend to the over-taxed, lower-income groups should now be cut or eliminated in order to maintain or increase the tax cuts to the middle and upper-income groups because entitlement spending is out of control. This is particularly so as a response to the increase in Social Security and Medicare entitlement expenditures that are expected to occur as a result of the baby boomers retiring since it is the baby boomers who paid the bulk of those excess payroll taxes that led to the $3 trillion Social Security Administration trust funds that were borrowed by the federal government and are now coming due.
Why the Government is Running Out of Money
By now it should be at least apparent, if not obvious, as to why “even though most of us have been paying for [Social Security and Medicare] all our working lives and now when it's time for us to collect, the government is running out of money” and “[w]hy . . . the government borrow[ed] from [the Social Security System] in the first place.” There’s really no mystery here, and it should be obvious from Figure 1 and Figure 2 that it had nothing to do with welfare or foreign aid, that is, the “support they give to other countries.” The government borrowed from Social Security to help reduce the deficits caused by the Reagan Tax Cuts given to the upper-income groups within our society, and the reason why the government is running out of money today is because, in response to the surpluses in the federal budget that borrowing from the Social Security System helped to create in the late 1990s and early 2000s, the Bush II administration gave even more tax breaks to the upper-income groups.
And there is also no mystery why we are seemingly “broke” in spite of the fact that we are one of the wealthiest countries in the world. It’s not because of out-of-control entitlement spending or welfare or the extravagance of our foreign aid, as right-wing propaganda would have you believe, though we certainly must do something about healthcare. It’s because of the Reagan and Bush II tax cuts. And there is no reason to believe that we needed those tax cuts because Americans were, and still are terribly over taxed.
The way in which the Reagan and Bush II tax cuts have affected our standing among the advanced countries of the world in terms of taxes collected is shown in Table 3.
Table 3: OECD Countries that Pay Less Taxes than We Do
Percent of GDP, 1980-2010.
1980 1990 2000 2005 2010 USA 26.4 Japan 28.6 Spain 34.3 Portugal 31.1 Portugal 31.3 Australia 26.2 Australia 28.0 Portugal 30.9 Ireland 30.1 Greece 30.9 Japan 24.8 USA 27.4 Australia 30.4 Australia 30.0 Switzerland 28.1 Switzerland 24.6 Portugal 26.8 USA 29.5 Switzerland 28.1 Japan 27.6 Spain 22.6 Greece 26.4 Switzerland 29.3 Japan 27.3 Turkey 25.7 Portugal 22.2 Switzerland 24.9 Japan 26.6 USA 27.1 Australia 25.6 Greece 21.8 Korea 19.5 Turkey 24.2 Turkey 24.3 Korea 25.1 Korea 17.1 Chile 17.0 Korea 22.6 Korea 24.0 USA 24.8 Mexico 14.8 Mexico 15.8 Chile 18.9 Chile 20.7 Chile 19.6 Turkey 13.3 Turkey 14.9 Mexico 16.9 Mexico 18.1 Mexico 18.8 Source: Organization for Economic Cooperation and Development, Comparative Tables.
You can see from this table the kinds of countries that pay less taxes than we do. The idea that we should dismantle Social Security and Medicare to keep from rescinding the Reagan-Bush II tax cuts so that Americans can enjoy the wonderful benefits countries like Mexico and Chile receive from their being able to pay lower taxes than we do makes no sense at all.
Bowles-Simpson and the Grand Bargain
This is what the debate over entitlement spending in Washington is about—Social Security, Medicare, Medicaid, and the taxes needed to sustain these programs. What this means is that if you are someone who is raging against high taxes and out of control entitlement spending, thinking that, somehow, this means welfare and foreign aid and not Social Security and Medicare, you are in for a rude awakening when you wake up one day to find that you have gotten your wish, and taxes on the upper-income groups in our society have been cut even further, entitlement spending is being brought under control by converting Social Security into what is essentially a welfare program financed by payroll taxes, and Medicare has become a program that rations healthcare by forcing those who can’t afford it to go without.
As I have explained elsewhere, converting Social Security into what is essentially a welfare program financed by payroll taxes and turning Medicare into a program that rations healthcare by forcing those who can’t afford it to go without is exactly what’s going to happen if those who insist on cutting taxes and entitlement spending are able to pass into law, in the name of a Grand Bargain, the proposals set forth by Erskine Bowles and Alan Simpson in their Moment of Truth Report. The proposals to cut taxes and dismantle Social Security and Medicare put forth in this report supposedly represent the bipartisan middle ground between those who seek to eliminate Social Security and Medicare and those who are attempting to save these programs, and the proposals in this report are actually being considered seriously in Washington today.
Those of you who think that Social Security doesn’t pay for you today should take a careful look at Figure 3 that shows the effect of the Bowles-Simpson recommendations on Social Security benefits over the next 70 years (in terms of 2010 benefits and prices) and do the math to figure out how reducing the maximum benefit from retiring at age 65 from $26,304/yr. to $14,294/yr., with no reduction in payroll taxes, is going to benefit your children and grand children. As you do this, try to keep in mind that this is the Social Security entitlement program you will be leaving to your children and grandchildren if the Bowles-Simpson recommendations become law.
Source: www.StrengthenSocialSecurity.org, Benefits Chart.
Where These Emails Come From
This email sounds like a rant from some poor soul distraught over the threat of not receiving his promised Social Security benefits, but it has all the earmarks of a carefully crafted, focus group tested piece of anti-government propaganda that is specifically designed undermine the public's confidence in the government and the Social Security system. It does not inform the public but, rather, has the effect of planting false information in the minds of the reader: It claims that nobody gets your Social Security if you are dead. That Social Security is not an entitlement. That entitlement's are charity. That Social Security is an investment program, not an insurance program. That anyone with an average income of $30k could have become rich if they had been allowed to invest your payroll taxes in a private investment account instead of paying them into the Social Security system. That we can't help our own because we give billions of dollars to other countries. That foreign aid and welfare are causing the government to run out of money rather than tax cuts. That the Social Security system represents treason in high places. All of these ideas are either explicitly or implicitly contained in this email; they all disparage both the government and the Social Security system, and none of them are true.
This email can best be understood in terms of the protocol set out in the article, ACHIEVING A 'LENINIST' STRATEGY, by Stuart Butler and Peter Germanis of the Heritage Foundation published in the Cato Journal in 1983. In that article Butler and Germanis complain about the existence of "a firm coalition behind the present Social Security system" and call for "guerrilla war against both the current Social Security system and the coalition that supports it." Their stated objective of this "guerrilla war" is to "divide this coalition and cast doubt on the picture of reality it presents to the general public."
The nonsense in this email makes no sense at all when taken at face value. It makes perfect sense when viewed from the perspective of the "guerrilla war" against the Social Security system called for by Butler and Germanis.