![]()
![]()
![]()
![]()
![]()
![]()
How a Conservative Would Balance the Federal Budget
George H. Blackford, © 11/26/2013
In a recent article published in Forbes Magazine, Jeffery Dorfman, a conservative economist, looks at the actual numbers in the federal budget and explains how it can be balanced without increasing taxes. In so doing Dorfman provides a framework in which it is possible to examine the actual choices conservatives offer in balancing the federal budget in the real world.
Dorfman's Budget Cuts
In his article Dorfman explains how the federal budget can be cut from the $3.7 trillion figure spent in 2013 if the government spends "only the amount it receives in revenue" which the OMB projects to be $3.0 trillion in 2014. Dorfman gives the following hypothetical allocation of federal expenditures as an example of how this can be accomplished.
$240 billion to interest on the national debt.
$860 billion to Social Security.
$860 billion to Medicare, Medicaid, and other healthcare spending.
$140 billion to Veteran’s benefits.
$83 billion to Department of Justice and general government.
$10 billion to science,
$13 billion to international affairs.
$25 billion to conservation and agricultural programs.
$90 billion to transportation.
$40 billion to education.
$137 billion to federal employee retirement programs.
$150 billion to welfare programs.
$400 billion to defense.
He then summarizes his budget as follows:
Most people will probably complain about one or more of the cuts proposed here. That is to be expected. If you didn’t notice, NASA and the Departments of Commerce and Energy were completely eliminated. Deep cuts were made to some other departments (Education, EPA, Agriculture, and HUD). Welfare spending was reduced. However, the point was not to propose a budget that people loved, but to show that a balanced budget was not completely beyond reason.
After all, the above spending paid all interest on the debt, left social security, veterans benefits, justice and law enforcement agencies, federal employee pensions, food stamps, and general government functions untouched, continued Medicare and Medicaid with some small cuts, and still spent non-trivial sums of money on education, transportation, and defense programs.
In the long run, if people want to restore some of the spending that I hypothetically cut above, we need to reform entitlements because that is where about three-quarters of the spending goes; principally to social security, Medicare, and Medicaid. The point above, however, was not to build a perfect budget or one that is sustainable in the long run, but just to show we could get by for a period of time without raising the debt ceiling.
Balancing Dorfman's Budget
In attempting to understand what this all means it is helpful to compare the numbers given above with the comparable numbers in the 2013 budget. This comparison is provided in Table 1 where the amount actually spent by the federal government in 2013 is shown in each category of government expenditure Dorfman considers along with the amount Dorfman proposed to spend in each category and the amount he implicitly proposes to cut:
Table 1: Dorfman's Budget versus the 2013 Budget
Category (billions)
2013
Dorfman
Change
%Change
Interest on the national debt
222.8
240.0
17.3
7.7
Social Security
818.4
860.0
41.6
5.1
Federal employee retirement
133.6
137.0
3.4
2.6
Veteran's benefits
139.6
140.0
0.4
0.3
Justice and general government
91.0
83.0
-8.0
-8.8
Medicare
510.5
497.7
-12.9
-2.5
Medicaid
266.6
259.9
-6.7
-2.5
Other healthcare
105.1
102.5
-2.6
-2.5
Science funding
30.7
10.0
-20.7
-67.5
International affairs
56.9
13.0
-43.9
-77.2
Conservation
23.5
20.0
-3.5
-14.9
Agriculture Research
5.3
5.3
0.0
0.0
Transportation
94.5
90.0
-4.5
-4.7
Education
84.6
40.0
-44.6
-52.7
Welfare
333.0
150.0
-183.0
-55.0
Defense
660.0
400.0
-260.0
-39.4
Everything Else
204.1
47.0
-157.1
-77.0
Total Expenditures
3780.3
3095.3
-684.9
-18.1
Undistributed Offsetting Receipts
-95.3
-95.3
0.0
0.0
Total Outlays
3684.9
3000.0
-684.9
-18.6
Office of Management and Budget (Table 3.2 Table 11.3).[1]
In constructing this table I have broken down "Medicare, Medicaid, and other healthcare spending" into three separate categories, Medicare, Medicaid, and Other healthcare, and have allocated the $860 billion allotted to these three categories in the Dorfman budget proportionally to their values in the 2013 budget. In addition, since there is no "welfare" category in the federal budget I have included the sum of all federal expenditures on Housing assistance, Food and nutrition assistance, and Public assistance and related programs from OMB's Table 11.3—Outlays for Payments for Individuals by Category and Major Program: 1940–2018 in the Welfare category in Table 1. I have also added a category for Everything Else to account for the categories of expenditures in the federal budget that Dorfman does not explicitly mention as well as the values for Total Expenditures, Undistributed Offsetting receipts, and Total Outlays.[2]
In examining Table 1 it is apparent that Dorfman has allowed for modest increases in three categories of expenditure: Interest on the national debt, Social Security, Veteran's benefits, and Federal employee retirement. At the same time there are dramatic cuts in other categories, the most dramatic being the $260 billion cut in Defense (39%) and the $183 billion cut in Welfare (55%). And even though the absolute dollar amounts are smaller, the program cuts in International affairs ($44 billion / 77%), Science Funding ($21 billion / 67%), Education ($45 billion / 53%) are equally dramatic. The most dramatic program cuts, however, are in that part of the budget Dorfman does not specify, the $186 billion in Everything Else which Dorfman implicitly proposes be cut by $157 billion. This cut amounts to 77% of these unspecified programs.
Dorfman's Budget In 2014
Dorfman has proposed this budget for 2014 to "show we could get by for a period of time without raising the debt ceiling" with the suggestion that "in the long run" people might want to restore some of the hypothetical cuts he has proposed. Thus it is instructive to compare Dorfman's budget to the OMB's proposed budget for 2014 and to look at the programs that people might want to restore.
Table 2 shows the OMB's proposed changes in the federal budget from 2013 to 2014:
Table 2: Proposed Change in Budget: 2013 to 2014
Category (billions)
2013
2014
Change
%Change
Interest on the national debt
222.8
222.9
0.1
0.1
Social Security
818.4
865.6
47.2
5.8
Federal employee retirement
133.6
140.9
7.3
5.5
Veteran's benefits
139.6
148.2
8.7
6.2
Justice and general government
91.0
87.7
-3.4
-3.7
Medicare
510.5
530.9
20.3
4.0
Medicaid
266.6
303.6
37.1
13.9
Other healthcare
105.1
139.1
34.0
32.3
Science funding
30.7
30.2
-0.6
-1.9
International affairs
56.9
55.9
-1.0
-1.8
Conservation
23.5
24.3
0.8
3.5
Agriculture Research
5.3
5.3
-0.1
-1.4
Transportation
94.5
103.8
9.4
9.9
Education
84.6
129.0
44.5
52.6
Welfare
333.0
328.6
-4.4
-1.3
Defense
660.0
626.8
-33.3
-5.0
Everything Else
204
124
-80.5
-39.4
Total Expenditures
3780.3
3866.3
86.1
2.3
Offsetting Receipts
-95.3
-88.5
6.8
-7.1
Total Outlays
3684.9
3777.8
92.9
2.5
Office of Management and Budget (Table 31-1).
Here we find a proposed increase in Total Outlays equal to 2.5% of the 2013 budget and a 2.3% increase in Total Expenditures. These increases are more or less in line with expected inflation, but a number of important increases in the individual categories are also proposed, the most dramatic being a $37 billion (14%) increase in Medicaid and the $34 billion (32%) increase in Other healthcare, presumably to accommodate implementation of the Affordable Care Act. In addition there is a $44.5 billion (53%) proposed increase in Education, a $47 billion (6%) increase in Social Security (presumably to accommodate the baby boomers retirement and cost of living adjustments), a $20 billion (4%) increase in Medicare, a $9 billion (6%) increase in Veteran's Benefits, $9 billion (10%) increase in Transportation, and a $7 billion (5.5%) increase in Federal employee retirement.
At the same time there is a $33.3 billion (5%) proposed cut in Defense along with $1 billion to $4 billion (1% to 4%) proposed cuts in all of the other categories specified in Dorfman's budget except Interest on the national debt (which is essentially unchanged) and a proposed cut of $80.5 billion (39%) in Everything Else.
Dorfman's budget is compared to the OMB's proposed 2014 budget in Table 3 where in constructing this table I have assumed, as Dorfman has indicated his intent to be, that all "interest on the debt [be paid] and social security, veterans benefits, justice and law enforcement agencies, federal employee pensions, food stamps, and general government functions [be] untouched." This requires, of course, that an additional $5 billion to $8 billion be added to the amounts that Dorfman's initially allocated to Social Security, Federal employee retirement, Veteran's benefits, and Justice and general government.
I have also assumed that the "small cuts" in Medicare of 2.5% of the 2013 budget is preserved with the same total of $860 billion that Dorfman proposed be spent on healthcare. This means that in addition to the 2.5% cut relative to 2013 levels of Medicaid and Other healthcare expenditures, the OMB's proposed expansions in these two programs are not funded. It should also be noted that the excess funds allocated to Interest on the national debt in Dorfman's original specification are absorbed in the rest of the budget in Table 3.
Table 3: Dorfman's Budget versus the Projected 2014 Budget
Category (billions)
2014
Dorfman
Change
%Change
Interest on the national debt
222.9
222.9
0.0
0.0
Social Security
865.6
865.6
0.0
0.0
Federal employee retirement
140.9
140.9
0.0
0.0
Veteran's benefits
148.2
148.2
0.0
0.0
Justice and general government
87.7
87.7
0.0
0.0
Medicare
530.9
497.7
-33.2
-6.3
Medicaid
303.6
248.5
-55.1
-18.2
Other healthcare
139.1
113.8
-25.3
-18.2
Science funding
30.2
10.0
-20.2
-66.8
International affairs
55.9
13.0
-42.9
-76.7
Conservation
24.3
19.7
-4.6
-18.9
Agriculture Research
5.3
5.3
0.0
0.0
Transportation
103.8
90.0
-13.8
-13.3
Education
129.0
40.0
-89.0
-69.0
Welfare
328.6
150.0
-178.6
-54.4
Defense
626.8
400.0
-226.8
-36.2
Everything Else
123.6
35.2
-88.4
-71.5
Total Expenditures
3866.3
3088.5
-777.8
-20.1
Undistributed Offsetting Receipts
-88.5
-88.5
0.0
0.0
Total Outlays
3777.8
3000
-777.8
-20.6
Dorfman has suggested that "the liberals might . . . not want Americans to realize that we can survive just fine with a lot less government spending" if the kinds of restrictions on government spending indicated in Table 3 are imposed on the federal government. He could be right. Maybe we can survive just fine with the kind of spending cuts Dorfman proposes. This may make sense if you don't think about it, but before jumping to this conclusion it is probably worth thinking about it first:
What would the federal government look like if Dorfman's hypothetical budget were to become a reality?
Where the Devil Lies
Even a casual look at Table 3 indicates that there are serious problems with Dorfman's plan to balance the budget, and a good place to start thinking about these problems is with Dorfman's proposal to cut Defense.
Defense
Dorfman argues that, given the other allocations he has made:
. . . Total spending has risen to $2.65 trillion.
This leaves only about $300 billion for defense spending. However, employee contributions to the retirement plan and some miscellaneous offsets that the government does not count as part of the $3 trillion in revenue expected next fiscal year bring in $90 billion per year. That means we can spend about $400 billion on defense and still have a balanced budget. This would reduce military spending back to 2003 levels, before we were fighting wars in the Middle East. Not a small cut, but probably feasible.[3]
In other words, Dorfman proposes cutting OMB's 2014 budget for Defense by $227 billion in addition to the $33 billion cut already built into the OMB's 2014 budget, a total cut of $260 billion. This is a 39% cut in Defense from its level in 2013. Does it really make sense to think this is feasible?
When we look at the actual numbers in the proposed 2014 budget in OMB's Table 31-1. Budget Authority and Outlays by Function, Category, and Program we find cuts of
10% in Military personnel plus Housing (to $141.4 billion),
18% in Operation and maintenance (to $218.3 billion), and
15% in Procurement (to $99.5 billion).
These three items stand at the core of our military preparedness—boots on the ground, operating and maintaining our military systems, weapons—and in the OMB's 2014 budget these three items summed to $459 billion after a 15% cut from their total in 2013. Even if all of Dorfman's Defense allocation of $400 billion were to go to these three items we would still be $59 billion short in funding them in his 2014 budget.
I suspect that few people would think it is a good idea in today's world to take an additional $59 billion out of these three items in Defense, especially when we consider the fact that we would be cutting them by 13% in addition to the original 15% cut proposed by the OMB. And if you are of a mind to restore this $59 billion cut in these three items in Dorfman's budget I would suggest you take a good hard look at the Dorfman budget in Table 3 and first decide just where you are going to get this $59 billion and stay within the $3.0 trillion spending limit Dorfman imposes.[4]
To make matters worse, if we were to devote all of Dorfman's $400 billion to the three items listed above there would be no money left to fund the proposed $66 billion in Research, development, test evaluation in Defense that is used to develop, test, and evaluate our military and weapons systems or the $21 billion proposed for Atomic energy defense activities component of Defense in the OMB's budget which is related to maintaining and securing our nuclear weapons arsenal, the $12 billion that is scheduled for Military construction, or the $4 billion in the proposed budget that goes to FBI.
What's more, Dorfman's claim that his cuts "would reduce military spending back to 2003 levels, before we were fighting wars in the Middle East" is true in a monetary sense, but is rather misleading in that it doesn't take into account the effects of inflation.
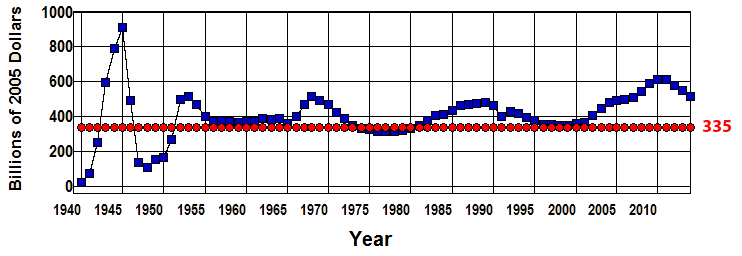
A 39% cut in Defense from 2013 to 2014 is a real cut in Defense, not simply a money cut. In real terms, Defense expenditures in 2013 came to $546.4 billion when measured in 2005 prices. A 39% cut in this figure would reduce it to $335 billion in terms of 2005 prices. This figure is put in perspective in Figure 1 which shows real defense expenditures in constant 2005 dollars from 1940 through 2013:
Figure 1: Real Defense Expenditures in Constant 2005 Dollars, 1940-2013
Office of Management and Budget: Table 3.2 Table 10.1
As can be seen in this figure, a 39% cut in real defense expenditures that left us with a $335 billion defense budget measured in 2005 prices would take us below where we were at the end of the 1990s ($348 billion in 1999) after the demobilization at the end of the Cold War and before the 9/11 attack. In fact, in terms of real expenditures, it would take us back to where we were in 1981. This was, of course, back during the Cold War, but it is worth noting that it was also a time in which the total real output of goods and services at home and in the rest of the world—which is directly related to the ability to produce real military weapons—was less than half what it is today, both for us and for our potential enemies as well.
I suspect that hardly anyone, be they liberal or conservative, would be willing to accept Dorfman's $227 billion cut in Defense on top of the $33 billion cut already built into OMB's 2014 budget, and especially not conservatives! Conservatives tend to advocate increases in Defense, not decreases.
It seems to me that, contrary to Dorfman's assertion otherwise, a cut in Defense of this magnitude is most certainly not feasible.
Education
A second area where I suspect hardly anyone would be willing to accept Dorfman's cuts in the area of Education. Aside from the fact that we have fallen behind many of the most advanced countries of the world in terms of our ability to educate our population, accepting these cuts is akin to biting the hand that feeds us. After all, the federal government doesn't actually run any grade schools, high schools, colleges, universities or other educational institutions other than our military academies. The bulk of the proposed $129 billion for Education in OMB's 2014 budget that Dorfman suggests be cut by $89 billion is money that is distributed to local educational institutions throughout the country.
Just five categories in the Education, training, employment, and social services section of Table 31-1 sum to $87 billion in 2013:
Education for the disadvantaged ($17.4 billion),
School improvement ($4.7 billion),
Special education ($13.1 billion),
Training and employment ($17.4 billion), and
Student financial assistance ($34.2 billion).
These funds go to support various state and local special education, occupational training and employment, student aid, education for the disadvantaged, and school improvement programs. Dorfman's allocation of $40 billion to Education leaves $57 billion of these programs unfunded even if we allocated all of his education budget to just these five categories. This means these funds would have to be made up through increases in state and local taxes if current levels of state and local spending on education in these areas are to be maintained. How many people really want to see these kinds of education expenditures cut or state and local taxes increased to maintain current levels of local education expenditures in these areas in order to save money on their federal income taxes?
Science Funding
Two items in the General science, space, and technology category in the OMB's Table 31-1 sum to $12.7 billion in OMB's 2014 budget:
National Science Foundation programs ($7.4 billion),
Department of Energy science programs ($5.3 billion).
These two items have already been cut by 13% in OMB's budget from what was spent in 2013. This means that not only is the $17.4 billion allocated to NASA eliminated in Dorfman's budget, all space related research funding contained in the NASA budget ($12.6 billion) is eliminated as well, and even if all of Dorfman's $10 billion allocation to Science Funding is allocated to the above two items, Dorfman's budget requires an additional 22% cut in these programs beyond the 13% cut that is proposed in the OMB's 2014 budget.
Since World War II our public investment in NASA and Science Funding has been the driving force in technological change in our country from integrated circuits to the internet. Does it really make sense for us to cut funding in this area?
Conservation & agriculture
The conservation and agriculture research programs that Dorfman proposes be funded in his budget are spread throughout three functional categories in OMB's Table 3.2: Agriculture, Energy, and Natural resources and environment. The specific budget items that relate to conservation and agriculture research within these functional categories, along with the amount allocated to each in the OMB's proposed budget, are:
Energy conservation ($2.1 billion),
Water resources ($8.1 billion),
Pollution control and abatement ($8.3 billion),
Conservation and land management ($10.8 billion),
Recreational resources ($1.0 billion), and
Agricultural research and services ($0.8 billion).
These items sum to $31 billion in OMB's 2014 budget, a 6% cut from the 2013 budget. Dorfman's budget funds these programs to the tune of only $25 billion which calls for an additional 19.5% cut.
It is also worth noting that none of the other programs that fall under the Agriculture, Energy, and Natural resources and environment functions in the federal budget are specifically funded in Dorfman's budget. Some of the programs that are ignored along with the amount allocated to each in OMB's 2014 budget are:
Nuclear waste program ($0.0 billion),
Electricity delivery and energy reliability ($0.7 billion),
Energy efficiency and renewable energy ($3.1 billion),
Emergency energy preparedness ($0.2 billion),
Nuclear Regulatory Commission ($0.1 billion),
Nuclear waste management and disposal program ($0.0 billion),
Electric Reliability Organization ($0.1 billion),
National Oceanic and Atmospheric Administration ($5.5 billion), and
United States Geological Service ($1.8 billion).
I would think that most people would want to restore, if not expand funding to at least some of these areas in the federal budget.
Welfare
I suspect that Dorfman's decision to cut welfare back "to basically food security programs (food stamps, WIC, the school lunch program) and housing assistance programs" without providing any funds for any of the Public assistance and related programs in OMB's Table 11.3—Outlays for Payments for Individuals by Category and Major Program: 1940–2018 will also not be acceptable to most people. The main categories in the unfunded portion of Dorfman's budget are:
Earned income tax credit ($55.6 billion),
Payment where child credit exceeds tax liability ($25.1 billion),
Supplemental security income program ($53.2 billion),
Veterans non-service connected pensions ($5.6 billion),
Family support payments to States and TANF ($21.3 billion),
Payments to States for daycare assistance ($5.8 billion), and
Payments to States—Foster Care/Adoption Assist. ($6.9 billion),
The first two items on this list, the earned income and child tax credits, go only to the working poor, people who pay 14.2% of their earned income in payroll taxes—a larger percentage than the Republican presidential candidate, Mitt Romney, paid in total taxes on tens of millions in unearned income.
The third item, SSI, is the primary social safety-net program that provides for indigent disabled and indigent elderly individuals who are either not eligible for Social Security or whose benefits fall below a subsistence level. What will happen to these elderly/disabled individuals if we arbitrarily defund the SSI program? And what possible justification could there be for defunding the fourth item on this list thereby denying veterans their non-service related pensions?
The next three programs on the list—Family support, daycare assistance, and Foster care and adoption assistance—are specifically designed to benefit children. How many people are willing to ignore the plight of children in an attempt to make a point with "the liberals . . . that we can survive just fine with a lot less government spending"? I suspect not very many.
Healthcare
I also suspect that many people will not be pleased with the "small" 6% cut in Medicare or the 18% cut in Medicaid and Other healthcare proposed by Dorfman even if they wish to eliminate funding for Obamacare.
In addition, the proposed $37 billion expansion of Medicaid in the OMB's budget is money that will be distributed to the states to fund the healthcare costs of uninsured local residents who currently seek healthcare at local hospital emergency facilities and, as a result, increase the cost of insurance for those who are insured.
It's hard to imagine that many people who actually thought about it would choose to pay the higher costs of providing medical care for the uninsured in emergency rooms through higher private insurance premiums and lower federal taxes rather that pay the lower costs of providing medical care for the uninsured through primary care physician with higher federal taxes that are more than offset by lower insurance premiums.
This is especially so in view of the fact that our healthcare system is the most expensive on earth and leaves our population less healthy than the more advanced countries of the world, all of which pay far less for healthcare than we pay both per capita and as a percent of GDP. (OECD OECD Charts NYT IOM JAMA1 JAMA2)
Transportation
Given the state of the roads and bridges in this country, it is hard to imagine that many would sanction the 13% cut in Transportation Dorfman proposes relative to the 2014 budget. According to the American Society of Civil Engineers' Report Card for America's Infrastructure:
Over two hundred million trips are taken daily across deficient bridges in the nation’s 102 largest metropolitan regions. In total, one in nine of the nation’s bridges are rated as structurally deficient, while the average age of the nation’s 607,380 bridges is currently 42 years. The Federal Highway Administration (FHWA) estimates that to eliminate the nation’s bridge backlog by 2028, we would need to invest $20.5 billion annually, while only $12.8 billion is being spent currently. The challenge for federal, state, and local governments is to increase bridge investments by $8 billion annually to address the identified $76 billion in needs for deficient bridges across the United States. . . .
Targeted efforts to improve conditions and significant reductions in highway fatalities resulted in a slight improvement in the roads grade to a D this year. . . . While the conditions have improved in the near term, and federal, state, and local capital investments increased to $91 billion annually, that level of investment is insufficient and still projected to result in a decline in conditions and performance in the long term. Currently, the Federal Highway Administration estimates that $170 billion in capital investment would be needed on an annual basis to significantly improve conditions and performance.
In spite of the conflict of interest apparent in this report, it is based on Federal Highway Administration data on bridges and highways. It seems to me that in light of these data, few people would like to see a 13% cut in federal spending on Transportation.
International Affairs
The total amount of humanitarian aid proposed in the OMB's 2014 budget is $24 billion, less than half of the total International affairs budget and only 0.7% of the entire 2014 budget proposed by the OMB. (Most of the rest of International affairs that is not in the $16 billion devoted to Conduct of foreign affairs is to be found in the $15 billion that goes to International security assistance.) The breakdown of the proposed aid in Table 31-1 is as follows:
Development assistance ($2.8 billion),
Department of Agriculture food aid ($0.9 billion),
Refugee programs ($2.1 billion),
Millennium challenge corporation ($0.7 billion),
Global health ($8.6 billion),
International disaster assistance ($1.6 billion),
Multilateral development banks (MDB's) ($2.9 billion),
Peace Corps ($0.4 billion),
International narcotics control and law enforcement ($2.3 billion),
USAID operations ($1.6 billion),
Overseas Private Investment Corporation (-$0.2 billion),
Credit liquidating accounts (-$0.6 billion).
Implementing Dorfman's suggestion that "[w]e can save some money by cutting . . . international affairs spending to $13 billion which is enough to fund Conduct of foreign affairs, but not pay foreign aid" would mean that the wealthiest country on earth would no longer be offering any humanitarian aid of any kind to the rest of the world. This is hardly the way to make friends and influence people. I would at least hope that most people would want to restore some of the humanitarian aid programs that are eliminated in Dorfman's budget.
Everything Else
We have already discussed some of the items that fall in the Everything else category in Dorfman's budget which Dorfman provides $47 billion to fund. They include the nine items listed in the section on Conservation and agriculture above, the seven items listed in the section on Welfare, and the twelve items listed in the section on International affairs. In addition, they also include those programs that are under-funded due to the Dorfman's proposed
"small cuts" in Medicare ($13 billion), Medicaid ($7 billion), and Other healthcare ($3 billion);
dramatic cuts in Defense ($260 billion) and Education ($45 billion); and
problematic cuts in Science funding ($21 billion) and Transportation ($5 billion).
We have also already discussed NASA, Energy, Education, training, employment, and social services, and Agriculture, but it is worth pointing out some of agencies that are funded through the Department of Commerce that Dorfman proposes to eliminate completely include the Bureau of Economic Analysis (BEA), Census Bureau, National Oceanic and Atmospheric Administration, Patent and Trademark Office, and the National Institute of Standards and Technology.
It is also worth noting that no funds are provided in Dorfman's budget for Community and regional development where we find $22.8 billion spent in 2013 under the heading Disaster relief and only $9.8 billion allocated in OMB's 2014 budget. And under the subheading Commerce and housing credit in Table 31-1, which Dorfman only deals with tangentially, we find the
Federal Housing Administration (FHA) loan programs,
Government National Mortgage Association (GNMA),
Rural housing insurance fund,
Small Business Lending Fund Program Account
National credit union administration,
FDIC Office of the Inspector General,
Federal Deposit Insurance Fund, and
Postal service.
In 2013, the programs that are included under Commerce and housing credit spent $17.7 billion. They are expected to bring in a net -$30.1 billion worth of 'outlays' in OMB's proposed 2014 budget. It's not at all certain how the programs for mortgage credit, deposit insurance, and postal service that fall under the function Commerce and housing credit in Table 31-1 would function under Dorfman's budget.
When we add it all up there are $778 billion worth of expenditures in the OMB's 2014 budget that Dorfman provides only $35 billion in the Everything else category to fund, and $684 billion in 2013 budget that Dorfman provides only $47 billion to fund, and it seems to me that neither the liberals nor the conservatives could live with this budget for even a short period of time.
I don't believe that the American people will accept a $260 billion cut in Defense in addition to the $13 billion cut proposed in the OMB's 2014 budget, a $7 billion cut in Medicaid, a $45 billion cut in Education, a $21 billion cut is Science funding, and a $5 billion cut in Transportation. Nor do I believe that a majority of the American people would accept doing away with the $56 billion earned income tax credit, the $25 billion Child tax credit, the $53 billion SSI program, the $25 billion spent on humanitarian foreign aid all in the name of balancing the federal budget or in an attempt to prove to "the liberals . . . that we can survive just fine with a lot less government spending." It seems to me that it is literally impossible to find a way to rearrange the spending priorities in Table 1 or Table 3 in such a way as to restore some of the budget items that Dorfman has hypothetically cut within the $3.0 trillion cap that he has imposed that would be acceptable to a majority of the American people.
Maybe I'm wrong. Maybe a majority of the American people can live with this budget and would like to see these cuts come to pass. As I have said before, we live in a democracy. I don't get to decide. The American people have to decide, but there is an even more important point to be made here. Namely, that this entire exercise of trying to find a way to balance the federal budget by cutting federal outlays to $3.0 trillion is, in its very nature, an exercise in futility. Even if we were to cut federal outlays to $3.0 trillion in 2014 it would not balance the budget!
You Can't Get There From Here
The fundamental contradiction in Dorfman's budget balancing scheme lies in his assumption that he will be able to balance the budget by simply cutting outlays to be consistent with the $3.0 trillion in federal revenue the OMB estimates the government will receive in 2014. The problem is that the OMB's $3.0 trillion estimate assumes federal expenditures are going to be $3,778 trillion in 2014—$92 billion more than the $3.685 trillion the OMB estimated federal outlays were in 2013. Dorfman is proposing that federal outlays be $685 billion less that its outlays in 2013. All you have to do to understand the futility of Dorfman's budget balancing scheme is ask: What will happen to federal revenues if the federal government abruptly cuts its expenditures by $685 billion in 2014?
Dorfman's $685 billion cut in government expenditures represents a $685 billion cut in income to those who would otherwise be on the receiving end of those expenditures—the government employees who are let go, the government contractors whose contracts are canceled, the companies whose sales to the government are cut back. As a result of their lost income federal tax revenue must fall to the extent that these individuals and businesses would have otherwise paid federal taxes on the $685 billion worth of income they have lost. Since the OMB's estimate of $3.0 trillion in tax revenue assumes that the taxes will be collected on this $685 billion in lost income, how are these lost tax receipts supposed to be made up in Dorfman's scheme?
A much more important problem in Dorfman's scheme, however, is that the OMB's estimate of $3.0 trillion in federal revenue in 2014 also assumes that gross income (GDP) from which federal taxes are collected will increase by 5.0% as a result of a 3% increased output and a 2% increase in prices. The $685 billion / 18% cut in government expenditures that Dorfman proposes represents a direct decrease of 4% in the total output of goods and services produced and gross income earned in the $17 trillion economy the OMB expects to see in 2014. What's more, this abrupt 4% decrease in production is supposed to take place in a situation in which Medicare is cut by 6%, Medicaid and Other healthcare by 18%, Science funding by 67%, International affairs by 77%, Conservation by 19%, Transportation by 13%, Education by 69%, Welfare by 54%, and Defense by 36% in terms of OMB's proposed 2014 budget; there is no funding for NASA, the Farm Program, or HUD, and where there is only $35 billion left over to balance out the inequities in the $811 billion worth of unfunded expenditures in Dorfman's budget.
To think that the output of goods and services would increase by 3% and prices would increase by 2% in this situation is a fantasy, and anyone who believes we would be "just fine" in this situation is whistling in the dark. The most probable result would be chaos. Consumers and investors would become very nervous, if not panicked in their willingness to spend in response to these cuts as would lenders in their willingness to lend. As consumers and investors cut back the total demand for goods and services in the economy would fall beyond the 4% drop that would be the direct result of the $865 billion cut in government expenditures that Dorfman proposes, and the entire economic system would be driven into a recession.
To put these numbers in perspective it may be helpful to compare them to what happened in 2008 and 2009 when the financial panic led to a 2.6% fall in the demand for goods and services (nominal GDP) and a 3.8% fall in the output of goods and services (real GDP), the difference being taken up by a 1.3% increase in prices. These decreases were accompanied by a 4 percentage point increase in the rate of unemployment (from 6.1% to 10.1%) from August 2008 through October 2009 as 6.6 million people lost their jobs.[5]
Dorfman's budget balancing scheme proposes taking 4% of real and nominal GDP right off the top, and he then assumes that somehow the government is still going to be able to take in $3.0 trillion in revenue, without raising taxes, in spite of the fact that the government was able to collect only $2.7 trillion in taxes in 2013 before $865 billion in government expenditures was taken out of the economy. This just isn't going to happen, and it's foolish to think that it will.
The end result of Dorfman's budget cut would not only be a fall in federal revenues below the $3.0 trillion the OMB assumes will be received in 2014 if government expenditures were not cut. In the face of Dorfman's $865 billion cut in federal expenditures and the resulting fall in consumer and investor demand this budget cut precipitated, the federal government would not even be able to take in the $2.7 trillion in revenue it managed to collect in 2013.
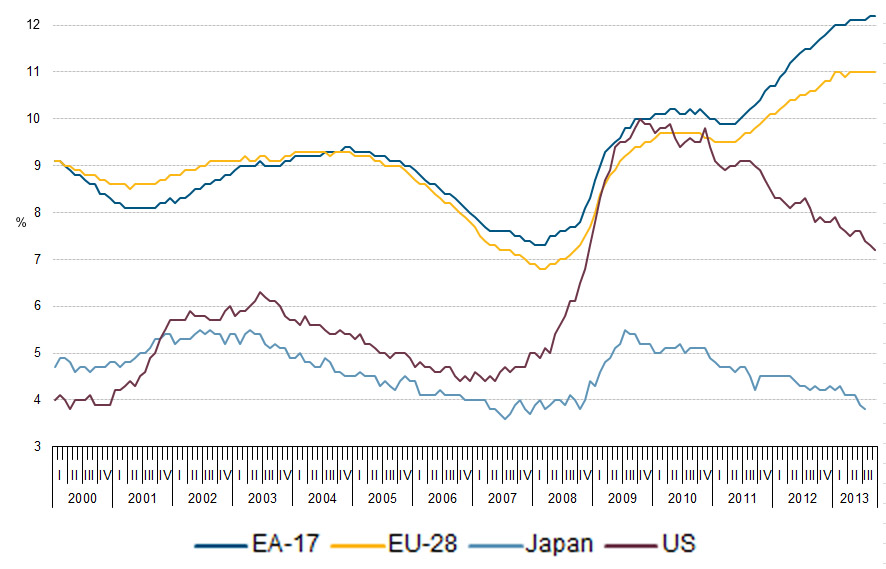
Dorfman's budget balancing scheme is the scheme European countries have followed with disastrous results since 2010 as they have chased falling revenues downward with more and more budget cuts. As is shown in Figure 2, the result has been soaring average rates of unemployment in the 17 Euro Area and 28 European Union countries as they tried to balance their budgets in the wake of the financial crisis as opposed to the more or less steady fall in the rate of unemployment in the United States and Japan where the deficit hawks have been less successful (though not entirely unsuccessful) in obtaining budget cuts.
Figure 2: Unemployment Rates in Europe, Japan, and the US
Europe is not the example we should be trying to follow.
Conclusion
It's a fool's errand to try to balance the budget by cutting government expenditures in the midst of an economic depression, and not just because it can't be done without depressing economic activity even further and causing unemployment to increase, but because of the destructive effects of high levels of long-term unemployment and depressed levels of economic activity on the potential for economic growth and because of the equally destructive effects of suboptimal levels of government expenditures in this regard. Long-term unemployment diminishes the skills of the unemployed, and the lack of investment that accompanies depressed levels of economic activity reduces the productive potential of the economic system in the future. At the same time, the failure of government to maintain our transportation, educational, healthcare, and social insurance systems diminishes the amount of social capital available to facilitate productive activity in the future.
The problem of an increase in unemployment caused by a decrease in government expenditures is, of course, a short-run problem as the economy will eventually adjust to the lower level of government expenditures in the long run. It is worth noting, however, that the process of long-run adjustment can take a very long time, even decades, when government outlays are cut in the midst of the kind of depressed economic situation we are in today. What's more, the loss of social capital and the concomitant loss in economic potential brought about by the failure of the government to maintain our transportation, educational, healthcare, and social insurance systems can never be recovered at the lower levels of government expenditures proposed by Dorfman.
In times of economic depression such as we are experiencing today we should be increasing government expenditures in order to build up our transportation, educational, healthcare, and social insurance systems, not cutting our public investment in these areas. This is especially so in light of the neglect these systems have experienced over the past thirty years. At the same time we should be increasing taxes to help pay for these investments rather than squandering our public resources on worthless tax cuts to the upper echelons of our society, tax cuts that neither stimulate the economy nor increase the amount of social capital available to facilitate productive activity in the future.[6]
Endnotes
[1] The Excel workbook used to make the calculations in this table and in tables below can be downloaded from www.rwEconomic.com by clicking on this link. For those who don't use Excel, all of OMB's tables used in this note can be obtained in PDF format here except for Table 31.1. A PDF of Table 31.1 can be obtained here.
[2] The federal government takes in money other than through taxes in the form of fees and other payments. These payments often arise from businesslike transactions with the public (fees collected by the FDIC for deposit insurance, for example) and are referred to as offsetting receipts in the federal budget. In most cases they are assigned to the specific functional category in which they arise, and are treated as a negative expenditure within that functional category. As a result, the outlays that appear in the individual functional categories of the budget indicate the governmental resources allocated to that category net of the resources allocated to that category through market mechanisms. Total Expenditures in Table 1 (and in the tables below) is obtained by adding these net expenditures over all categories in the budget.
There are some sources of non-tax receipts that do not arise from businesslike transactions with the government (payments by Federal agencies to employee retirement funds, for example) or that do arise from businesslike transactions with the government but are so large that they would distort the functional totals if they were assigned to the functional category in which they arise (payments on federal oil and gas leases, for example). These payments are not assigned to a particular functional category in the budget, and are referred to as undistributed offsetting receipts. They represent funds that are available to the general fund to be distributed throughout the budget. As a result, in order to obtain the total amount of resources expended by the government, Undistributed offsetting receipts must be added to Total Expenditure in Table 1 to arrive at Total Outlays, (See: UNDISTRIBUTED OFFSETTING RECEIPTS.)
[3] Dorfman's arithmetic is a bit fuzzy here in that $2.65 trillion out of $3.0 trillion leaves $350 billion for defense. If we add the $90 billion in "miscellaneous offsets" we would have $440 billion left for defense, but if Dorfman were to allocate all $440 billion to Defense there would be only $7 billion left in the Everything else category in Table 1. Dorfman's allocation of $400 billion to Defense rather than $440 billion leaves $47 billion for Everything Else in Table 1. Allocating $440 billion to the Dorfman budget in Table 3 would lead to a $5 billion deficit in the Everything Else category.
[4] If you wish to experiment with the $3.0 trillion budget constraint in Dorfman's budget to see by how much a change in Defense would require changes in other categories of his budget you can downloading the Excel spreadsheet used to make the calculations in Table 1 and Table 3 and change the numbers in the Dorfman column in these two tables to see what happens to Everything Else. So long as Everything Else stays nonnegative the $3.0 trillion constraint is met.
[5] Total federal revenues also fell by $419 billion during this period, but this fall cannot be attributed solely to the 2.6% fall in GDP since the Economic Stimulus Act was passed on February 13, 2008 and the American Recovery and Reinvestment Act passed on February 17, 2009. Both of these acts cut taxes.
[6] The appropriate way to manage federal debt when the economic system is depressed is the subject of A Note on Managing the Federal Budget. Ways to deal with our current crisis are examined in Social Security, Healthcare, and Taxes.