![]()
![]()
![]()
![]()
![]()
![]()
Understanding the Federal Budget
Chapter 5: Summary and Conclusion
This eBook is available at Amazon.com for a $2.99 contribution to this website.
Over the past forty years there has been a concerted effort on the part of the Conservative Movement to defund the federal government. (ATR Heritage Germanis Frank) Many people have been convinced by this movement that we can, somehow, solve our fiscal problems by cutting the federal budget even further than we have over the past thirty-five years and, at the same time, provide an effective national defense, maintain our Social Security and Medicare programs, and not decimate our social safety net or the rest of the federal government. (PewUSA Pew)
Does it really make sense to think we can cut the federal budget by as much as, say, 10% and, at the same time, provide an effective national defense and maintain our Social Security and Medicare programs without decimating our social safety net or the rest of the federal government? Can we solve our fiscal problems by cutting defense? What about waste, fraud, and abuse? Is it possible to solve our fiscal problems by eliminating waste, fraud and abuse in the federal budget?
What do we find when we look at the actual numbers in the budget?
Summary of the Federal Budget
Figure 5.1 is constructed from the OMB's Table 3.1—Outlays by Superfunction and Function. This figure plots a breakdown of the actual expenditures of the federal government from 1940 through 2013 in terms of its three largest categories (Superfunctions)—Defense, Human Resources, and Net Interest—plus All Other Outlays which is calculated by subtracting the sum of the three largest categories from Total Outlays.
Source: Office of Management and Budget. (3.1 10.1)
What does Figure 5.1 tell us about our ability to cut the federal budget without cutting Social Security or Medicare and without decimating our social safety net or the rest of the federal government?
Defense
With the end of the wars in Iraq and Afghanistan and the possibility of realigning our budget priorities away from the military threats we faced twenty-five or thirty years ago and toward those we face today, there may be some room to maneuver when it comes to Defense. But there is no reason to believe we can solve all of our fiscal problems simply by cutting Defense. Defense was only 18.2% of the federal budget in 2013 and 3.8% of our gross income. Even if we were to cut Defense in half—which virtually no one would be willing to do—it would reduce the federal budget by less than 10%.
Net Interest
Net Interest in Figure 5.1 must be paid when it comes due, so nothing can be saved there.
All Other Outlays
As for All Other Outlays in Figure 5.1, as was noted, this category is constructed by subtracting the sum of Defense, Human Resources, and Net Interest from Total Outlays. It shows us how much the federal government spent on everything else the government does. All Other Outlays consists of such things as expenditures on Administration of Justice, General Government, Energy, Natural Resources and Environment, Transportation, Community and Regional Development, International Affairs, General Science, Space, Technology, Agriculture, and everything else the federal government does.
It is obvious—or at least it should be obvious to anyone who looks at the actual expenditures of the federal government in this category plotted in Figure 5.1—that there is no reason to believe we can save a substantial amount of money by cutting All Other Outlays without substantially inhibiting the government's ability to function. The expenditures on programs in this category have already been cut by over 50% relative to the economy since 1980—from 15.4% of the budget and 3.2% of the GDP in 1980 to 5.3% of the budget and 1.2% of GDP in 2013—and even if we were to eliminate all of these expenditures completely—which, of course, we can't do and still have a functioning government—we would succeed in reducing the size of the federal budget by only 5.3%%.[32]
Thus, if we are serious about saving as much as 10% of our total federal taxes, unless we are willing to make draconian cuts in Defense and the rest of the federal budget, we must look to Human Resources. That's where the money is, and it's also where Social Security and Medicare are as well as the other social-insurance programs that make up our social safety net.
Does it really make sense to think we can save a lot of money by cutting Human Resources without cutting Social Security or Medicare or without decimating the programs that make up our social safety net?
Summary of Human Resources
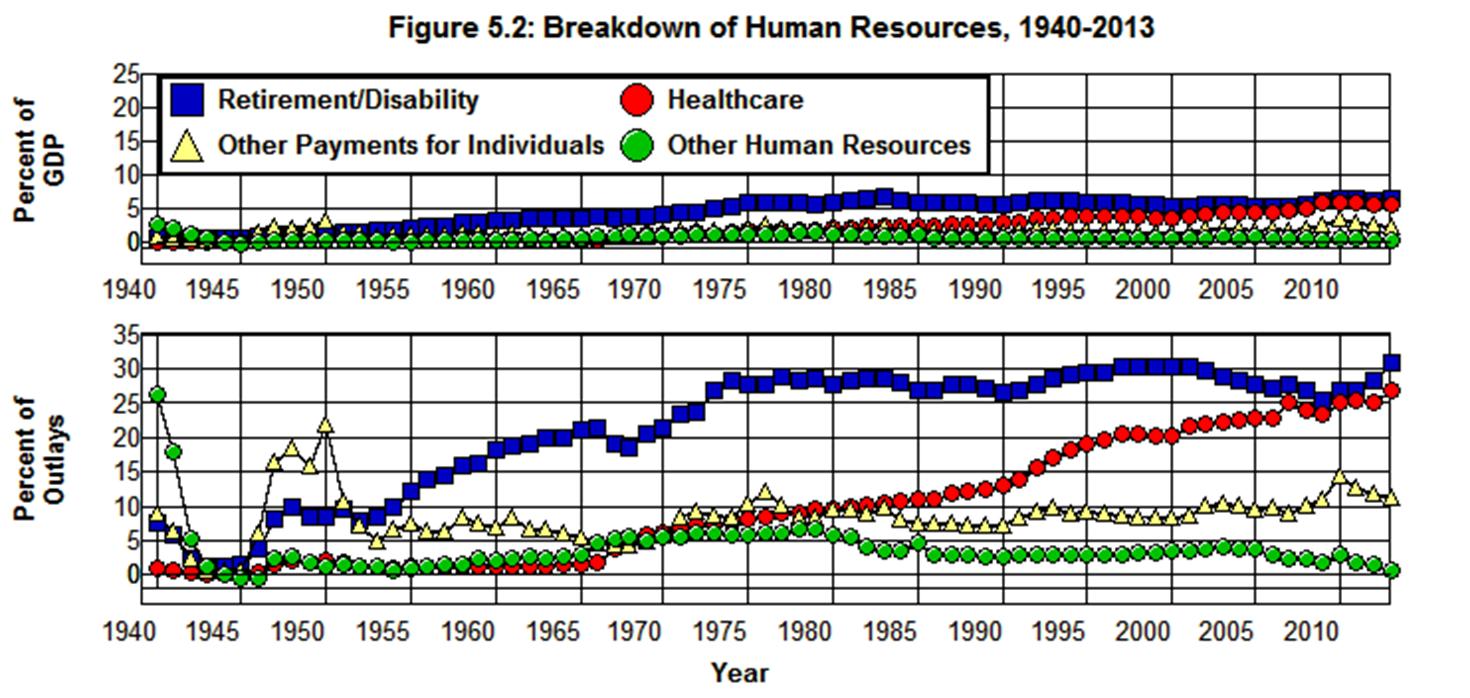
Figure 5.2 is constructed from the OMB's Table 11.3—Outlays for Payments for Individuals. This figure breaks down the Human Resources portion of the budget into four components. The first, Retirement/Disability, is the sum of all federal expenditures on retirement and disability programs listed in Table 11.3. The second, Healthcare, is the sum of all federal expenditures on healthcare listed in Table 11.3. The third, Other Payments for Individuals, is the sum of all federal expenditures on all payments-for-individuals programs listed in Table 11.3 that are not medical or retirement/disability programs. The final component, Other Human Resources, is constructed by subtracting the sum of the other three components in Figure 5.2 (i.e., the total of Outlays for Payments for Individuals in OMB's Table 11.3) from Human Resources in Figure 5.1. It is the total of all government expenditures on all other Human Resources programs.
Source: Office of Management and Budget. (11.3 3.1 10.1)
It is clear from Figure 5.2 that Retirement/Disability and Healthcare combined dominate Human Resources as they accounted for some 83% of all Human Resources expenditures in 2013. This would suggest that if we are to find ways to make substantial cuts in Human Resources we should begin by looking at Retirement/Disability and Healthcare.
Retirement/Disability
Table 5.1 shows all of the federal programs listed in the OMB's Table 11.3 that are included in Retirement/Disability in Figure 5.2 along with the amount spent on each program in 2013, the percent of GDP each program consumed in that year, and the percent of the federal budget each program consumed.
Table 5.1: Expenditures Included in Retirement/Disability, 2013.
Program (2013)
Billions of
DollarsPercent of
GDPPercent of
OutlaysSocial security and railroad retirement: $814.5
4.90%
23.58%
Social security: old age and survivors insurance $667.2
4.01%
19.31%
Social security: disability insurance $140.1
0.84%
4.06%
Railroad retirement (excl. social security) $7.2
0.04%
0.21%
Federal employees retirement and insurance: $194.0
1.17%
5.62%
Military retirement $54.3
0.33%
1.57%
Civil service retirement $77.2
0.46%
2.23%
Veterans service-connected compensation $59.4
0.36%
1.72%
Other $3.2
0.02%
0.09%
Public assistance and related programs: $55.5
0.33%
1.61%
Supplemental security income program $50.3
0.30%
1.46%
Veterans non-service connected pensions $5.2
0.03%
0.15%
Total: Retirement/ Disability
$1,064.0
6.40%
30.80%
Source: Office of Management and Budget. (11.3 3.1 10.1)
It is clear from this table that Retirement/Disability is dominated by Social Security in that fully 76% of the total in 2013 went to Social Security where 19% went to civil service, military, and railroad retirement/disability programs, and 5% went to the Supplemental Security Income (SSI) program. It is equally clear from this table that there is no way to make substantial cuts in this portion of Human Resources without cutting Social Security. After all, military, civil servants, railroad employees, and other government employees are just as entitled to their retirement/disability benefits as are Social Security recipients.
This leaves the SSI program which was only 5% of Human Resource expenditures in 2013 and 1.5% of the entire federal budget. Aside from the fact that SSI was only 1.5% of the budget in 2013 and 0.3% of our gross income in 2013, as we saw in Chapter 4, SSI is the primary social safety-net program that provides for indigent disabled and indigent elderly individuals who are either not eligible for Social Security or whose Social Security benefits fall below a subsistence level. Not only would substantial cuts in this program save virtually nothing, they would tear a hole in our social safety net.
What about Healthcare?
Healthcare
Table 5.2 shows all of the federal programs listed in the OMB's Table 11.3 that are included in Healthcare along with the amount spent on each in 2013, the percent of GDP each program consumed in that year, and the percent of the federal budget each program consumed.
Table 5.2: Expenditures Included in Healthcare, 2013.
Program 2013
Billions of
DollarsPercent of
GDPPercent of
Budget$583.8
3.51%
16.90%
$273.0
1.64%
7.90%
$310.8
1.87%
9.00%
$265.4
1.60%
7.68%
$9.5
0.06%
0.27%
$51.8
0.31%
1.50%
$43.6
0.26%
1.26%
$8.2
0.05%
0.24%
$15.6
0.09%
0.45%
$4.3
0.03%
0.12%
$7.3
0.04%
0.21%
$3.2
0.02%
0.09%
$0.8
0.00%
0.02%
Total: Medical care
$926.1
5.57%
26.81%
Source: Office of Management and Budget. (11.3 3.1 10.1)
Here we are looking at 27% of the Total Outlays. It is clear from this table that Medicare and Medicaid dominate Healthcare in that these two programs accounted for over 90% of Healthcare expenditures in 2013 with Medicare accounting for 70% of that 90%. What about the 30% of this 90% that went to Medicaid?
Medicaid represented 7.68% of the federal budget and 1.6% of our gross income in 2013 and, again, as we saw in Chapter 4, in 2008 some 75% of Medicaid's beneficiaries were either poor children, indigent blind/disabled individuals, or indigent elderly adults age 65 and over. Over 85% of Medicaid's expenditures went to these individuals. Medicaid lies at the very core of our social safety net, and it would appear there is very little room to cut here without causing a great deal of hardship and misery through the denial of medical services to poor children or indigent blind/disabled or indigent elderly adults.
That leaves the remaining 10% of the Human Resources budget that went to the other healthcare programs listed in Table 5.2. Here we are talking about 2.2% of the entire federal budget and 0.5% of our gross income in 2013. Of that 10% of Human Resources that went to the other healthcare programs, 67% went to veterans (Hospital and medical care for veterans and Uniformed Services retiree health care fund), 12% to Children's health insurance, and 5.6% went to Indian health, 9.5% went to Health resources and services (a program that is designed to meet the healthcare needs in mostly rural underserved areas), 4% went to Substance abuse and mental health services (a program that is severely underfunded given the extent of the substance abuse and mental health problems in our country), and 1% went to Other federal healthcare programs.
Veterans certainly have as much right to their medical benefits as Medicare recipients, so there is no reason to think we can or should cut veterans' medical benefits without cutting Medicare as well, and the rest of these programs play an important role in our social safety net. In addition, since the rest of these programs consumed only 0.73% of the entire federal budget in 2013 and 0.15% of our gross income there is virtually nothing to be saved by eliminating them.
The leaves but two categories in Figure 5.2 to examine: Other Payments for Individuals and Other Human Resources.
Other Payments for Individuals
Other Payments for Individuals includes the expenditures on all of the federal programs in the OMB's Table 11.3 that are not medical or retirement/disability programs. The items included in this category along with the amount spent on each in 2013, the percent of GDP each program consumed in that year, and the percent of the federal budget each program consumed are given in Table 5.3.
Table 5.3: Non-Medical and Non-Retirement/Disability Programs, 2013.
Source: Office of Management and Budget. (11.3 3.1 10.1)
The first thing that should be noted about this table is that, in spite of the abundance of programs, we are talking about only 11.5% of the entire federal budget in 2013 and 2.4% of our gross income here. While there were no programs that dominated this category, the ten largest items in Table 5.3 are arranged from largest to smallest and listed in Table 5.4. These ten items accounted for 94% of the total expenditures in the Other Payments for Individuals category in 2013.
Table 5.4: Ten Largest Items in Other Payments for Individuals, 2013.
Program 2013
Billions of
DollarsPercent of
GDPPercent of
Budget$82.5
0.50%
2.39%
Unemployment Assistance $68.3
0.41%
1.98%
$57.5
0.35%
1.66%
$44.9
0.27%
1.30%
$39.3
0.24%
1.14%
$21.6
0.13%
0.63%
$21.2
0.13%
0.61%
$19.3
0.12%
0.56%
$13.2
0.08%
0.38%
$6.8
0.04%
0.20%
Total: 10 Largest in Other Payments for Individuals
$374.6
2.25%
10.84%
As we saw in Chapter 4, the ten programs listed in Table 5.4 are the backbone of our social safety net. We're talking about the Earned income and Child Tax Credits (20% of Total: Other Payments for Individuals in Table 5.3) that are designed to encourage work and assist the working poor who pay over 14% of their earned income in payroll taxes. We’re talking about Food Stamps (SNAP), Special milk, and Supplemental Feeding programs (25%) that assist the poor in feeding themselves and their children. About Student Aid (11%), Unemployment Compensation (17%), Veterans education benefits (3.3%), and about Foster Care and Adoption (1.7%). And we're talking about only 11.5% of the entire federal budget in all of the programs in Other Payments for Individuals combined and 2.4% of our gross income.
There is no reason to think that we can obtain a great deal of savings by making substantial cuts in this portion of the budget without dismantling our social safety net and causing a great deal of hardship and misery. The money just isn't in these programs, and it's through these programs—combined with Medicaid and SSI—that our war against hardship and misery is waged.
Other Human Resources
This leaves only Other Human Resources in the Human Resources portion of the budget. Other Human Resources is the total of government expenditures on all Human Resources programs that are not included in the other categories in Figure 5.2. This residual can be disposed of rather quickly. It represented less than 1% of the budget in 2013 and less than 0.2% of our gross income, and, aside from the fact that this is insignificant in the grand scheme of things, as is shown in Figure 5.2, the programs in this portion of the budget have already been virtually eliminated since 1980.
That’s it! That's all there is to the entire federal budget! Defense, Net Interest, and All Other Outlays in Figure 5.1 plus Retirement/Disability, Healthcare, Other Payments for Individuals, and Other Human Resources in Figure 5.2 make up the entire federal budget. Everything in the budget on which the federal government spends money is included in one or another of these seven categories.
Waste, Fraud, and Abuse
There are widespread complaints about waste, fraud, and abuse in the federal budget, and we should strive to eliminate such activities wherever and whenever possible. At the same time, there is no reason to believe our efforts in this regard can have much of an effect on the size of the federal budget.
Defense and Healthcare
As was noted above, it may be possible to eliminate some waste in the defense budget as we demobilize from the Iraq and Afghanistan wars and through realigning our budget priorities away from the military threats we faced twenty-five or thirty years ago and toward those we face today. It was also noted above that in order to cut the total budget by 10% in this way we would have to cut Defense by more than 50%, and virtually no one is willing to cut the defense budget by this amount.
And then there’s Healthcare.
According to the Organization for Economic Cooperation and Development (OECD), the World Health Organization (WHO), and the Central Intelligence Agency World Factbook we spent more than twice as much per person as the average of the other OECD countries ($8,233 compared to $3,153) in 2010 and almost twice as much as a percent of our gross income (17.6% compared to 9.4%), and, yet, we ranked 24th among the 34 OECD countries in life expectancy (51st among all countries), 28th among these 34 countries in infant mortality (50th among all countries),[33] 24th among all countries in the availability of doctors, 25th in mother’s health, 37th in the overall performance of our healthcare system.
In other words, even though we spend more on healthcare than any other country in the world, and spend twice the average of what the other OECD countries spend, we benefit less from our expenditures than most of the OECD countries benefit from theirs in that their people live longer than we do; they are healthier than we are, and the rate at which their children die in infancy is less than the rate at which our children die in infancy. (OECD OECD Charts NYT IOM JAMA1 JAMA2 STC WHO) There is obviously something wrong here!
Both private and public healthcare costs in the United States have increased dramatically over the past fifty years, and even though the Affordable Care Act (ACA) promises to improve the health of our population by increasing the availability of healthcare, there is little reason to believe that the ACA will lead to substantial savings to taxpayers in the absence of a public option. It is either a public option or some kind of single-payer mechanism that makes it possible for healthcare costs to be controlled in those countries that have better health statistics than we do, and there is little reason to believe we will be able to control our healthcare costs, and, at the same time, improve the health of our population until we implement a similar system at home.
It is also worth noting that even though reforming our healthcare system by adopting a public option or implementing some kind of single-payer mechanism will undoubtedly save taxpayers’ money, it will not necessarily reduce the size of the federal budget or lead to lower taxes. Depending on the kind of system implemented, the savings to taxpayers could be accomplished through a net savings in the combined private and public costs of healthcare as private healthcare costs (paid directly by taxpayers) fall by more than public healthcare costs (and taxes) go up.
Specific Instances of Waste, Fraud, and Abuse
The fundamental problem with Defense is to be found in policy decisions that misalign our budget priorities, and the fundamental problem with Healthcare is our over-reliance on a private, corporate-oriented, multiple-payer, third-party, fee-for-service payment system that makes it impossible to produce optimal healthcare outcomes at a reasonable cost. Specific instances of waste, fraud, and abuse are trivial in comparison to the systemic problems in Defense and Healthcare. The numbers just don't add up. This is particularly so when we are talking about such things as $200 hammers or $7,000 coffee pots. Eliminating this kind of waste, fraud, and abuse simply will not, and cannot have a significant effect on the size of the federal budget.
The federal budget amounted to $3,454.6 billion in 2013. Ten percent of $3,454.6 billion is $345.5 billion. That's 345,460 millions! This means that in order to reduce the budget by 10% one million dollars at a time we would have to find 345,460 instances in which one million dollars worth of waste, fraud, or abuse occurs on an annual basis. We can’t even count to 345,460 let alone find 345,460 ways in which the federal government squanders one million dollars on an annual basis. Even if we could find a new way to save a million dollars a year every day it would take almost a thousand years to save $345.5 billion in this way. (345,460 / 365.25 = 945.8) It would take almost 100 years to save this amount if we were to save $10 million a day. Even when there are specific instances of waste, fraud, and abuse that run in the hundreds of millions or even billions of dollars the numbers just don't add up to $345.5 billion. (Coburn Sanders MFCU NYT StLuisFed Riedl)
When we look at Figure 5.3, which shows how the federal budget is actually spent in the real world, the numbers become even more problematic.
Source: Office of Management and Budget’s (11.3 3.2 10.1).[34]
Payments for Individuals
As is shown in Figure 5.3, Payments For Individuals made up 69% of the budget in 2013.[35] While there may be some inefficiency in the administration of the programs in this 69% of the budget, administrative costs are relatively insignificant compared to the benefits paid out. Medicare's administrative costs, for example, are as little as 2% of the benefits it pays out and Social Security's as little as 1%. These two programs alone took up 40% of the total budget in 2013, and even if we were to eliminate all of their administrative costs—which we can't do and still make these programs work—it would reduce the total budget by less than 1% (0.02 x 0.4 = 0.008 = 0.8%).
This means that in order to find significant amounts of waste, fraud, and abuse in this 69% of the budget we have to look at the tens of millions of beneficiaries whose benefits average in the thousands of dollars. Now we are talking about the need to find millions of instances of waste, fraud, and abuse on an annual basis in the thousands of dollars range, not just hundreds of thousands in the millions of dollars range. There is no way we can expect to do this without expanding the size of the federal bureaucracy, and since it costs money to expand the federal bureaucracy, there is no guarantee we will be able to reduce the budget at all by doing this even if by doing this we are able to eliminate all of the waste, fraud, and abuse that may exist among the tens of millions of beneficiaries these programs serve. It may even cost more to expand the bureaucracy than can be saved. This is especially so in light of the fact that there doesn't seem to be any reason to believe that waste, fraud, and abuse is very widespread among these beneficiaries in the first place.
The nature of this problem can be seen by examining a report published by the Federal Reserve Bank of St. Louis in which it estimated that some $3.3 billion worth of fraudulent unemployment compensation claims were paid in 2011. That works out to 3.06% of the total $108 billion worth of claims that were paid in a program that had 3.7 million beneficiaries in 2011. The point is that we can't simply eliminate this $3.3 billion worth of fraudulent unemployment compensation claims by waving a wand or by increasing the amount of money we spend to investigate those few who are actually committing this fraud, 88,000 of whom were collecting benefits while working part time and being paid under the table. We have to investigate all of the 3.7 million beneficiaries in order to find those few, and this can't be done without paying people to do it.
Since the $108 billion in unemployment compensation claims amounted to only 3% of the $3,603 billion federal budget in 2011, and only 3.06% of this 3% was wasted in specific instances of fraud, that works out to 0.09% of the entire federal budget that was wasted in fraudulently collected unemployment claims (0.0306 x 0.03 = 0.000918 = 0.09%). This means that even if we are successful in eliminating all of the $3.3 billion in fraudulent unemployment compensation claims in the system, the most we can save by doing this is 0.09% of the total budget, and if it costs us more than $3.3 billion to expand the bureaucracy in order to eliminate this 0.09% of the total budget it will actually cost us more to eliminate this fraud than we can save. It also means that if we were to find similar rates of fraud (3.06%) in the rest of the 69% of the budget taken up by payments to individuals the most we can save by eliminating this fraud is 2.1% of the total budget (0.0306 x .69 = 0.021114 = 2.1%), and if it costs us more than $73 billion (0.0306 x 0.69 x 3,454.6 = 72.9404) to expand the bureaucracy in order to do this, it will cost us more than we can save.
This doesn't mean we shouldn't try to eliminate waste, fraud, and abuse in this portion of the budget wherever and whenever we can. It only means we should not expect to be able to save $72 billion or reduce the federal budget by as much as 2.1% as a result of our efforts to do so.
As for the rest of the budget, there is no reason to believe significant savings can be found there either. We have already discussed Defense—fraud or no fraud, virtually no one is willing to cut defense by a sufficient amount to make a significant difference in the size of the total budget—and, as was noted above, Net Interest must be paid when it comes due so nothing can be saved there. As was also noted above, All Other Outlays in Figure 2 has already been cut by almost 50% since 1980 and Other Human Resources in Figure 3 has almost disappeared. The programs in these last two categories take up less than 7% of the total budget, and since they have been cut so dramatically over the past thirty years, there is no reason to think we can save a substantial amount by rooting out fraud in this less than 7% of the budget.
Again, that’s it! That’s all there is to the entire federal budget! There’s no place else to go to eliminate waste, fraud, and abuse in the federal budget.
Summary and Conclusions
In searching for ways to cut the federal budget it is important to understand that cutting a small amount from a large portion of the budget or a large amount from a small portion of the budget may yield what seems to be a lot of money in absolute terms, but it doesn't yield a lot of money relative to the size of the total budget. It only reduces the total budget by a small amount. To reduce the total budget by a large amount we have to cut a large amount from a large portion of the budget. That's just grade school arithmetic.
When we look at the actual numbers in the federal budget we find it is not possible to cut a large amount from a large portion of the budget without cutting defense, Social Security, Medicare, or the programs that make up our social safety net because that's where the money is. There simply isn't enough money in the rest of the budget to make a difference even if we were to cut a large amount from this small portion of the budget. What’s more, the rest of the budget has already been cut to the bone since 1980, and the federal government would simply be unable to function if we were to make large cuts in this small portion of the budget.[36]
Even though there may be savings to be found in realigning our defense priorities as we demobilize from the Iraq and Afghanistan wars, and there are definitely substantial savings to be found in reorganizing healthcare by adopting a public option or single-payer system, there is no reason to believe we would be able to reduce the size of the total budget by a substantial amount even if we were to realize these savings. We would have to cut the defense budget by more than half in order to reduce the total budget by 10% in this way, something which virtually no one is willing to do, and, depending on the kind of single-payer option implemented, implementing a single-payer system in order to improve the efficiency of our healthcare system could require an increase rather than a decrease in the size of the federal budget in order to reduce overall healthcare cost (taxes plus private costs) paid by taxpayers.
When it comes to specific instances of waste, fraud, and abuse, all we can hope to do by expanding our efforts in this area is cut a small amount from a large portion of the budget, and doing this could actually cost us more than we can save by doing it. As has been noted, this does not mean we should ignore this problem. It only means that we should not expect to see a substantial reduction in the size of the budget as a result of our efforts to solve it. Those who think otherwise have a problem with arithmetic. Their numbers just don't add up. (Coburn Sanders MFCU NYT StLuisFed Riedl)
A fundamental, real-world truth that has been almost completely ignored in the otherwise hopelessly irrational debate we have been subjected to over the past forty years is that there are certain things only the government can do. One is providing a system of national defense. Another is providing legal and law enforcement systems that set and enforce the rules in a fair, efficient, and effective way. Another is providing the public education and infrastructure that makes possible such things as an educated labor force and an efficient transportation system. Another is providing a social-insurance system that gives ordinary people insurance against the personal devastation can be caused by the vagaries of life. Yet another is providing a financial regulatory system that facilitates a stable, growing economy. (Amy Musgrave Lindert Kleinbard)
These essential government services and benefits cannot be provided in a fair or just or efficient or effective manner by private enterprise guided by the profit motive. They can only be provided in this manner by a democratically elected government whose elected officials are dedicated to achieving these ends. And they most definitely cannot be provided in this manner by elected officials whose sole objective is to cut taxes and, thereby, defund the government programs that are designed to provide these essential government services and benefits.
For thirty years following World War II our democratically elected government made huge investments in our society. It built our Interstate Highway System. It expanded our educational systems through grants in aid and such programs as the GI Bill and National Defense Education Act as it subsidized the education of the best and the brightest among us who, in turn, provided the scientific research that led to the tremendous advances in technology we have seen in the past sixty years. It also made huge investments in our physical infrastructure and in our social-insurance system. The end result of these public investments was a highly educated and productive labor force, a tremendous increase in our physical infrastructure, and a social environment that provided the social capital that made it possible for our economic, political, and social systems to flourish. If these systems are to flourish again, the physical infrastructure and social capital that made this possible in the past must not only be maintained, they must be allowed to grow, and this cannot be accomplished today without a substantial increase in government expenditures.
Allowing our physical infrastructure and social capital to grow not only increases productivity, it expands our economic system into areas that provide huge social benefits—education, police and fire protection, regulation, public health, scientific and technological research, social insurance, and the construction of physical infrastructure such as streets, roads, highways, bridges, subways, trains, ports, water treatment and sanitization facilities, schools, public lighting, hospitals, parks, beaches, and other recreation facilities—that balance our economic system in areas that cannot be provided efficiently by the private sector. (Amy Musgrave Lindert Kleinbard)[37]
Since the 1970s we have lowered taxes on the wealthy and increased taxes on the not so wealthy as we dismantled our regulatory systems and cut back on social welfare and other government programs that serve the common good and promote the general Welfare. In the process we have consumed a substantial portion of the public investments we had accumulated in the past as we allowed those investments to depreciate. The result has been a fall in income for the vast majority of our population and a growing divisiveness within our society as we have fallen behind in educating our children, our physical infrastructure has deteriorated, the rate of increase in productivity has fallen, our healthcare system has become the least efficient among the most advanced countries of the world, we have the highest incarceration rate in the world, our national debt has grown dramatically relative to the size of the economy since 1980, and fraud has run rampant in our financial system leading to the worst economic disaster since the Great Depression. This is the legacy of our attempts to eliminate waste, fraud, and abuse in the federal government by simply cutting taxes and the federal budget.
It is the incongruous belief that, somehow, we can have all of the essential services and benefits that only government can provide and, at the same time, cut the taxes and defund the government programs designed to provide these services and benefits that has led us to the nonfunctioning government we have today. The simple fact is, it is impossible for the government to function to provide these services and benefits if we refuse to raise the taxes needed to pay for the government programs that provide these services and benefits.
The only way we can have the essential services and benefits that only government can provide is by raising the taxes needed to pay for these services and benefits and then demanding that these services and benefits be provided by our democratically elected government: an effective national defense; a fair and just legal and criminal justice system; quality public education; effective public health programs; efficient streets, roads, highways, and other forms of public transportation; a clean and safe environment; safe foods, drugs, and other consumer products; safe working conditions; an effective and efficient personal healthcare system; a viable social-insurance system; and a stable, growing economy that is not plagued by cycles of booms and busts that drive our country and people deeper and deeper into debt and lead to economic catastrophes brought on by epidemics of fraud, recklessness, and irresponsible behavior on the part of those in charge of our financial institutions.[38] (Amy Musgrave Lindert Kleinbard)
National income in the United States was $14,577 billion in 2013, and total federal outlays came to $3,456 billion. This means the total tax liability created by the OMB’s projected 10.6% deficit for 2019 amounts to 2.5% of our national income. There was a surplus in the federal budget equal to 2.4% of GDP in 2000 before the massive 2001-2003 Bush tax cuts, before the invasion of Iraq, and before those who ran our financial institutions devastated our economy. The bulk of these tax cuts were made permanent in the American Taxpayer Relief Act of 2012. Does it really make sense to make dramatic cuts in Social Security or Medicare or to dismantle a major portion of the rest of the federal government rather than rescind the tax cuts in this Act and return to the tax structure we had in 2000? We could even increase taxes by the extra 1% or 2% of our national income that would be required to replenish the physical infrastructure and social capital we have consumed over the past thirty-five years and allow these kinds of public investments to grow for the benefit of our children and grandchildren if we wanted to. These are the kinds of actual, real-world choices we must make if we are to solve the fiscal problems with which we are faced today. (Kleinbard)
Endnotes
[32] See How a Conservative Would Balance the Federal Budget for a discussion of how a conservative economist, Jeffery Dorfman, suggests these functions should be cut.
[33] The OECD countries that have shorter life expectances than we have are Czech Republic, Mexico, Poland, Slovakia, Hungary, Estonia, and Turkey. Of these countries Slovakia, the Czech Republic, and Hungary have lower infant mortality rates than we do. (OECD OECD Charts JAMA1 JAMA2)
[34] Since we are looking at fractions of Total Outlays in this chart, Commerce and Housing Credit and Undistributed Offsetting Receipts are included in Everything Else in Figure 5.3. Figure 0.5 looks at the budget in terms of fractions of Total Expenditures where Total Expenditures are arrived at by subtracting Commerce and Housing Credit and Undistributed Offsetting Receipts from Total Outlays.
[35] As we have seen in Table 5.1 through Table 5.4 above, the bulk of these expenditures in this 69% of the budget are to be found in the Retirement/Disability (Social Security, 21% of the budget, and military and other federal employee retirement benefits, 5%), Healthcare (Medicare 16%; Medicaid, 7%; and Veterans health programs, 1.4%), and Other Payments for Individuals (SNAP (formerly Food stamps) (including Puerto Rico), Child nutrition and special milk programs, Supplemental feeding programs (WIC and CSFP), and other nutrition programs, 3.2%; Earned income tax credit, 1.7%; Payment where child credit exceeds tax liability, 0.6%; Supplemental security income program, 1.5%; Housing assistance, 1.1%; Family support payments to States and TANF, 0.6%; and Daycare and Payments to States—Foster Care/Adoption Assist., 0.3%).
[36] See How a Conservative Would Balance the Federal Budget for a analysis of what it would mean to make large cuts in this small portion of the budget.
[37] Balancing our economic system in this way has the added effect of decreasing the concentration of income and bolstering our mass markets as income is transferred through our tax system to those areas in the public sector that provide the kinds of huge economic and social benefits the private enterprise cannot provide—benefits that are essential to the economic prosperity and the social wellbeing of our society. See: Amy, Musgrave, Lindert, Kleinbard, and Where Did All The Money Go?
[38] See Where Did All The Money Go? for a detailed explanation of how defunding the government’s regulatory system led to the financial crisis that began in 2007.