On Having Our Cake And Eating It Too
George H. Blackford © 8/5/2013
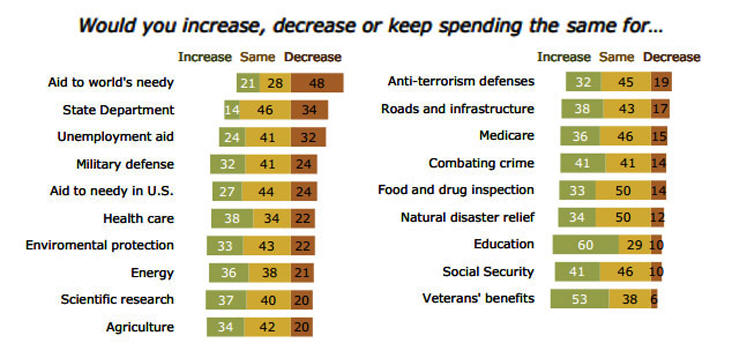
In a recent survey, the Pew Research Center asked 1,504 respondents: "If you were making up the budget for the federal government this year, would you increase spending, decrease spending or keep spending the same for" nineteen different categories of government expenditures. The expenditure categories and results of the survey are given in Figure 1.
Figure 1: Pew Research Center Survey Results, February 2013.
Source: Pew Research Center
These results suggest that the vast majority of the American public is satisfied with the size of the federal government we have, and, if anything, would like to see it increase rather than decrease: For all categories of expenditures, other than the first three, a larger proportion of the respondents would choose to increase rather than decrease expenditures, and even in the first three categories a majority of those who had an opinion would either increase expenditures or keep them the same. In addition, the three categories that more people would rather decrease than increase—Aid to the world's needy, State Department, and Unemployment aid—sum to just 4% of the federal budget while just five of the categories in which more respondents wish to increase rather than decrease—Social Security, Military defense, Medicare, Health care, and Aid to needy in U.S.—sum to over 70% of the federal budget.
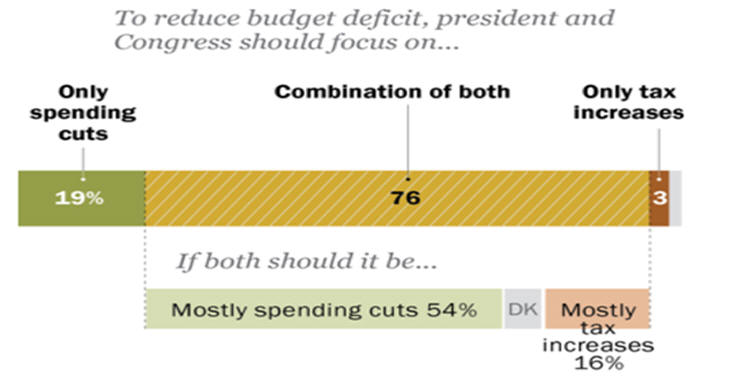
These results stand in stark contrast with those of the Pew Research Center/USA Today survey conducted later that same month in which the respondents were asked if the president and Congress should focus on spending cuts, tax increases, or both in order to reduce the federal budget deficit. The results of this survey are given in Figure 2.
Figure 2: Pew Research Center/USA Today Survey Results, February 2013.
Source: Pew Research Center/USA Today
Here we find that the overwhelming majority of people (73%) would like to see the federal deficit problem solved through only or mostly spending cuts rather than through only or mostly tax increases (19%). In other words, the vast majority of the American people want to have their cake and eat it too: Even though they would choose to either increase the size of federal expenditures or keep them the same, at the same time, they would choose to reduce the federal deficit by cutting government expenditures rather than by increasing the taxes needed to fund the expenditures they wish to increase or keep the same.
According to the OMB the, federal deficit was equal to 30% of total federal expenditures in 2012. As a result of rescinding some of the provisions of the 2001-2003 tax cuts combined with the expected recovery of the economy and some spending cuts, this deficit is projected to decline to 10% of total expenditures by 2018. It is obvious that we are not going to be able to eliminate the remaining 10% deficit through mostly spending cuts—as, apparently, 73% of the American people want to do—by cutting the 4% of the budget that goes to Aid to the world's needy, the State Department, or Unemployment aid.
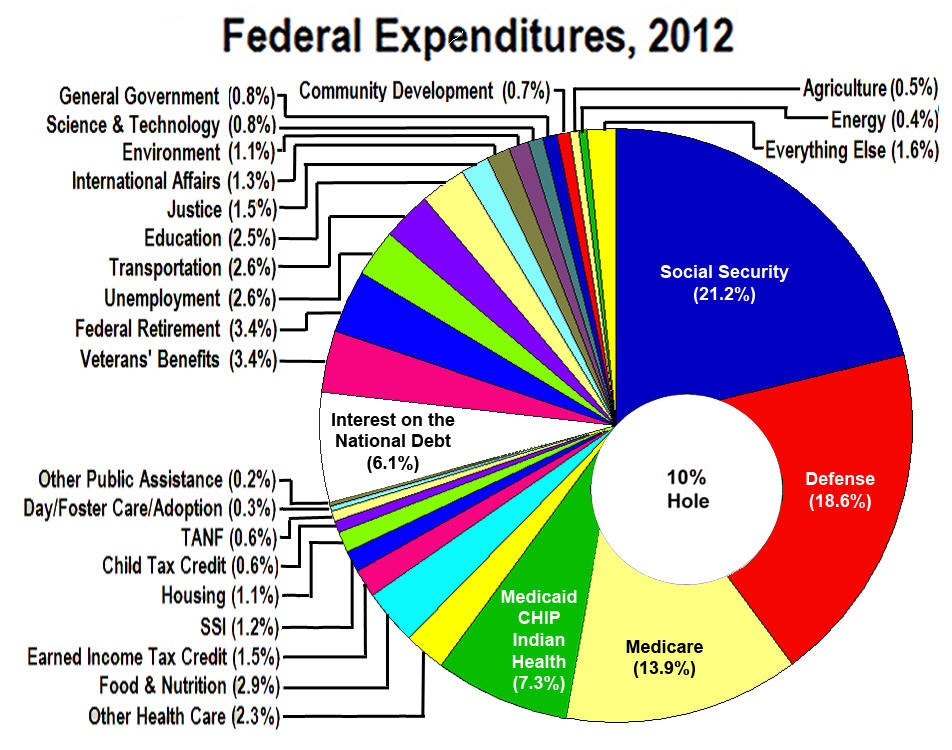
If we are to eliminate the 10% deficit projected for 2018 through mostly spending cuts we are going to have to cut the 70% of the budget where we find Social Security, Military defense, Medicare, Health Care, and Aid to needy in U.S. because that's where the money is. As can be seen in Figure 3, which shows a breakdown of the entire federal budget with a 10% hole in it, the money is not in the 24% of the budget that is left after we deduct the 6% we must pay in interest on the national debt.
Figure 3: Pie Chart of Federal Expenditures 2012 with a 10% Hole.
Even a causal examination of this chart reveals that it is impossible to maintain the government the vast majority of the American people seem to want and, at the same time, reduce the deficit by as much as 10% through mostly spending cuts:
Maintaining our current levels of expenditures on Social Security and Medicare—as over 80% of the respondents in the Pew poll say they would chose to do—leaves only 60% of the budget to cut after deducting the 6% of the budget that goes to interest on the national debt. It would require a 17% cut in the rest of the budget to cut the total budget by 10% if we were to exempt Social Security and Medicare from cuts.
Maintaining our current levels of expenditures on aid to the needy in addition to those on Social Security and Medicare—as over 80% of the respondents in the Pew poll also say they would chose to do—would require a 23% cut in defense and the rest of the budget to cut the total budget by 10%.
And if we were to include maintaining our current levels of defense expenditures as well—as over 70% of the respondents in the Pew poll say they would chose to do—it would require a 39% cut in the rest of the budget to cut the total budget by 10%.
Where are these cuts supposed to come from?
If we really do want to balance the budget and, at the same time, provide the government that the vast majority of the American people seem to want, balancing the budget through mostly tax increases makes much more sense to me than trying to do so through mostly spending cuts. This is especially so in view of the fact that the tax increase needed to fill a 10% hole in the federal budget would amount to less than 2.3% of our personal income.
But we live in a democracy. I don't get to decide. This is something a majority of the American people must decide, and the first thing we as a people must decide is whether we want to keep the government we have, as an overwhelming majority of the people seem to want to do, or dismantle that government in an attempt to balance the federal budget, as an equally overwhelming majority of the people also seem to want to do. We can't do both, and if we want to keep the government we have we must accept the fact that we have to raise the taxes needed to pay for it.
Sources
All of the budget numbers in this note are compiled from six tables published in an Excel spreadsheets format on the Office of Management and Budget's website:
Table 1.1—Summary of Receipts, Outlays, and Surpluses or Deficits (-): 1789–2018
Table 2.1—Receipts by Source: 1934–2018
Table 2.5—Composition of "Other Receipts": 1940–2018
Table 3.2—Outlays by Function and Subfunction: 1962–2018
Table 4.1—Outlays by Agency: 1962–2018
Table 11.3—Outlays for Payments for Individuals by Category and Major Program: 1940–2018
and two from the Bureau of Economic Analysis:
Table 3.2. Federal Government Current Receipts and Expenditures
I have downloaded these tables into a single Excel workbook that shows where the numbers cited above come from in these tables and contains all of the formulas used to calculate the percentages cited above. This workbook can be downloaded by clicking on this link.


