![]()
![]()
![]()
![]()
![]()
![]()
Notes on Herd Immunity and Coronavirus Statistics
Download Pandemic Statistics
IndexOn Herd Immunity
Updates on Increases In US Fatalities
State Statistics
Country StatisticsOn Herd Immunity
South Korea and the United States both confirmed their first case of Covid19 on January 20, 2020 and as of May 14 Korea has suffered 265 deaths as a result of Covid19 and the US 86,912. This translates into 5 deaths per million for Korea and 265 per million for the United States. If the United States had been able to obtain Korea's mortality rate of 5 deaths per million the United States would be looking at 1,652 deaths (328.2 x 5) from the Coronavirus rather than the 86,912 deaths we see today, and some 85,260 lives that were lost to the Coronavirus could have been avoided during this period of time.
South Korea accomplished their control of the Coronavirus by following the standard procedures proscribed by the CDC—hand washing, face masks, testing, contact tracing, quarantining, barring social gatherings, and other kinds of mitigation referred to as 'social distancing'—in the CDC's 2017 Community Mitigation Guidelines to Prevent Pandemic Influenza and in Obama's Playbook for Early Response to High Consequence Emerging Infectious Disease Threats and Biological Incidents that was prepared for and passed on to the Trump administration.
Following these procedures is exceedingly important in responding to an outbreak of a novel virus that is highly contagious, spreads asymptomatically (that is, spread by people who have no symptoms), has a relatively high mortality rate, and for which there is no effective vaccine or treatment in that it slows the rate of infection within the population. If the rate of infection is not slowed it threatens to overwhelm the healthcare system which will increase the number of deaths that result from the virus, not only because many of those who become infected will not be able to obtain lifesaving treatment, but because many of those who become ill who are not infected will not be able to receive lifesaving treatment as well. In addition, once the healthcare system is overwhelmed it will become virtually impossible to protect those individuals who are most vulnerable to the ill effects of this virus to the extent the population as a whole becomes overwhelmed by the disease as well. In the case of the Coronavirus this last point is of particular importance.
In the absence of an effective vaccine or treatment for the Coronavirus the only way to bring the spread of this disease to an end is through the development of what is referred to as ‘herd immunity’ within the population. Herd immunity is achieved once a sufficient portion of the population—estimates to range from 40% to 80%—has become infected and, as a result, has received sufficient immunity from the disease upon recovery to prevent the disease from spreading further within the population.
The seriousness of the Coronavirus pandemic as it relates to the importance of being able to protect the most vulnerable to the ill effects of this disease as the population achieves herd immunity is reflected in the table of case mortality rates in Table I below that shows an average mortality rate of 2.26% of confirmed cases experienced by South Korea during the current pandemic and a breakdown of mortality rates for various age groups from 0.0% to 23.71%. This table shows fatality rates among Korean Coronavirus victims that are more than twice as high for those over 80 years of age compared to those in their 70s and almost four times as high for those in their 70s compared to those in their 60s.
To the extent the Korean fatality rates are applicable to the United States we can estimate the effects of not being able to protect the most vulnerable of our population in the process of achieving herd immunity by applying Korea’s rates to the age distribution of the population of the United States as is done in Table II. This table shows the number of fatalities that can be expected in the United States to the extent the Korean fatality rates apply if all age groups are infected proportionally in achieving herd immunity (Hd. Im.) through infecting 40%, 60%, or 80% of the population.
The number of deaths that can be expected if all age groups were to achieve the same degree of infection is calculated in this table by multiplying 40%, 60%, and 80% of each age group in the United States by its corresponding Korean fatality rate in order to achieve the expected number of deaths for each age group . The individual deaths for each age group are then summed to obtain the total deaths to be expected depending on the extent to which infections must spread in order to achieve herd immunity at 40%, 60%, or 80% of the population. As can be seen from this table, the total number of deaths to be expected if herd immunity were to be achieved with 40% of the population infected would be 2.6 million (2,605 thousand), with 60% of the population infected would be 3.9 million (3,907 thousand), and with 80% of the population infected would be 5.2 million (5,209 thousand).
Alternatively, an effort could be made to protect that 3.6% of the population that is 80 years of age or older through isolation and prophylactic testing of all who come in contact with them to the extent necessary to reduce the fatality rate of this age group to 0.0%. Achieving 40%, 60%, and 80% herd immunity in this situation would require increasing the infection rate of the remaining 96.4% of the population to 41%, 62%, and 83%, respectively. The results are given in Table III where we find that total number of deaths would be reduced from 2.6 million deaths to 1.5 million with 40% of the population infected, from 3.9 million to 2.3 with 60% of the population infected, and from 5.2 million to 3. 1 million with 80% of the population infected. Thus, Table III indicates that to the extent the Korean fatality rates apply to the United States’ population protecting the 3.6% of the population that is 80 years of age or older can reduce the toll of the Coronavirus pandemic by as many as 1.3, 1.6, or 2.2 million deaths in the process of achieving herd immunity depending of the degree of infection needed to achieve this end.
Similarly, the results in Table IV show that protecting the 10.5% of the population that is 70 years of age or older would reduce the total number of deaths from 2.6 million to 652 thousand with 40% of the population infected, from 3.9 million to 971 thousand with 60% of the population infected, and from 5.2 million to 1.3 million with 80% of the population infected. Thus, Table IV indicates that to the extent the Korean fatality rates apply to the United States’ population protecting the 10.5% of the population that is 70 years of age or older can reduce the Coronavirus toll by as many as 1.95, 2.9, or 3.9 million deaths in the process of achieving herd immunity in the absence of an effective vaccine or treatment.
The numbers in these tables are, of course, tentative. There is no reason to believe they measure what they purport to measure precisely. There could be any number of Coronavirus cases that existed that were not confirmed in Korea, and there could be any number of Coronavirus deaths that were not identified as such. In fact, virtually nothing that is known about the Coronavirus is known precisely whether we are talking about infection or fatality rates, the rate at which people become infected, the total number of infections or fatalities, the proportion of the population that must become infected to achieve herd immunity, the extent to which recovery from the illness yields immunity, or how long the immunity once achieved will last.
Just the same, even if the numbers in Table II are divided in half we still end up with numbers that are ominous; numbers that are from three to six times the number of Americans lost during the four years of World War II (419 thousand). These numbers clearly indicate that this pandemic must be taken seriously, especially in light of what we have learned, or should have learned from the experience we have had in dealing with this virus so far that is fairly obvious, namely, that:
1. The Coronavirus is extremely contagious with a relatively high mortality rate that is spread by infected individuals who are asymptomatic, that is, by individuals who are infected but show no symptoms.
2. Over the course of three months we have already accumulated over 90 thousand Coronavirus deaths in the United States and we were only able to slow the exponential growth of this virus recently by shutting down a major portion of the economy.
3. Given the novel nature of this virus it is unlikely that a vaccine or effective treatment will be developed and become widely available in the near future.
4. Because of the highly contagious nature of this virus it is also unlikely that herd immunity will be achieved before a relatively large proportion of the population has been infected.
5. If the spread of this virus is not controlled until a significant degree of herd immunity is achieved infections will increase exponentially to the effect that it will overwhelm out healthcare system.
6. If our healthcare system is overwhelmed the deaths that result will be significantly greater than those that would result if the system were not overwhelmed, not simply because many who become infected will be unable to receive effective treatment, but because many of those who become injured or ill who are not infected will also be unable to receive effective treatment. In addition, if the entire population becomes overwhelmed it will become impossible for many of those who are most vulnerable to the virus to protect themselves from infection.
7. The only way to control the spread of this virus is through hand washing, wearing masks, social distancing, widespread and frequent testing of essential workers, and contact tracing and testing of all who have had contact with an infected person and quarantining all who test positive.
8. To the extent these measures are not implemented systematically and conscientiously throughout the population as we attempt to open up our economy the death toll from the Coronavirus in the United States is going to increase significantly.
In the end, the toll taken by this pandemic will ultimately depend on our ability to slow down the process of achieving herd immunity and how quickly an effective treatment or vaccine can be developed and widely distributed.
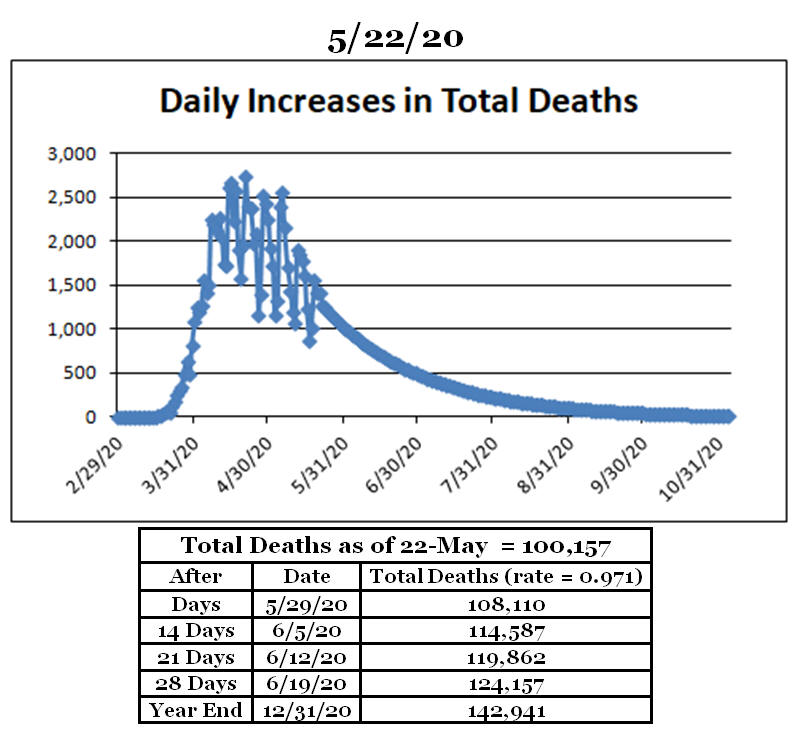
Below is a graph that shows the reported daily increases in Coronavirus deaths in the United States from February 29 through May 22 with projections for this series from May 23 through the end of the year that are generated by a simple time series model that assumes the series continues to follow the geometric rate of decrease reflected in the seven-day moving average of the series leading up to May 22. This graph is followed by a table that summarizes the projections in this graph for the following four weeks and through the end of the year. It will be interesting to see the extent to which the opening of the economic system that we are in the midst of today affects our ability to follow the geometric trend depicted in this graph as summarized in the table.
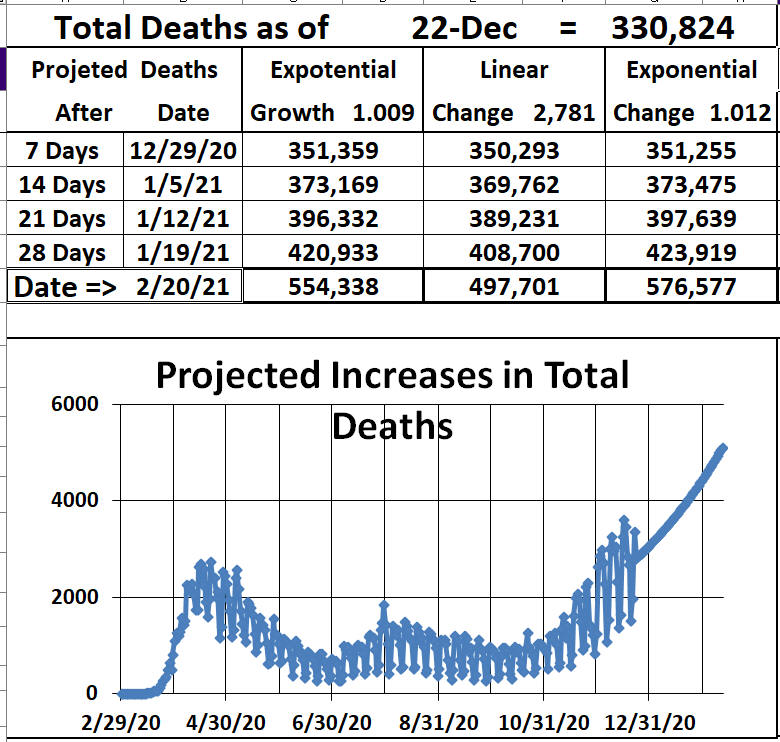
Update on Fatalities as of Dec 22, 2020:
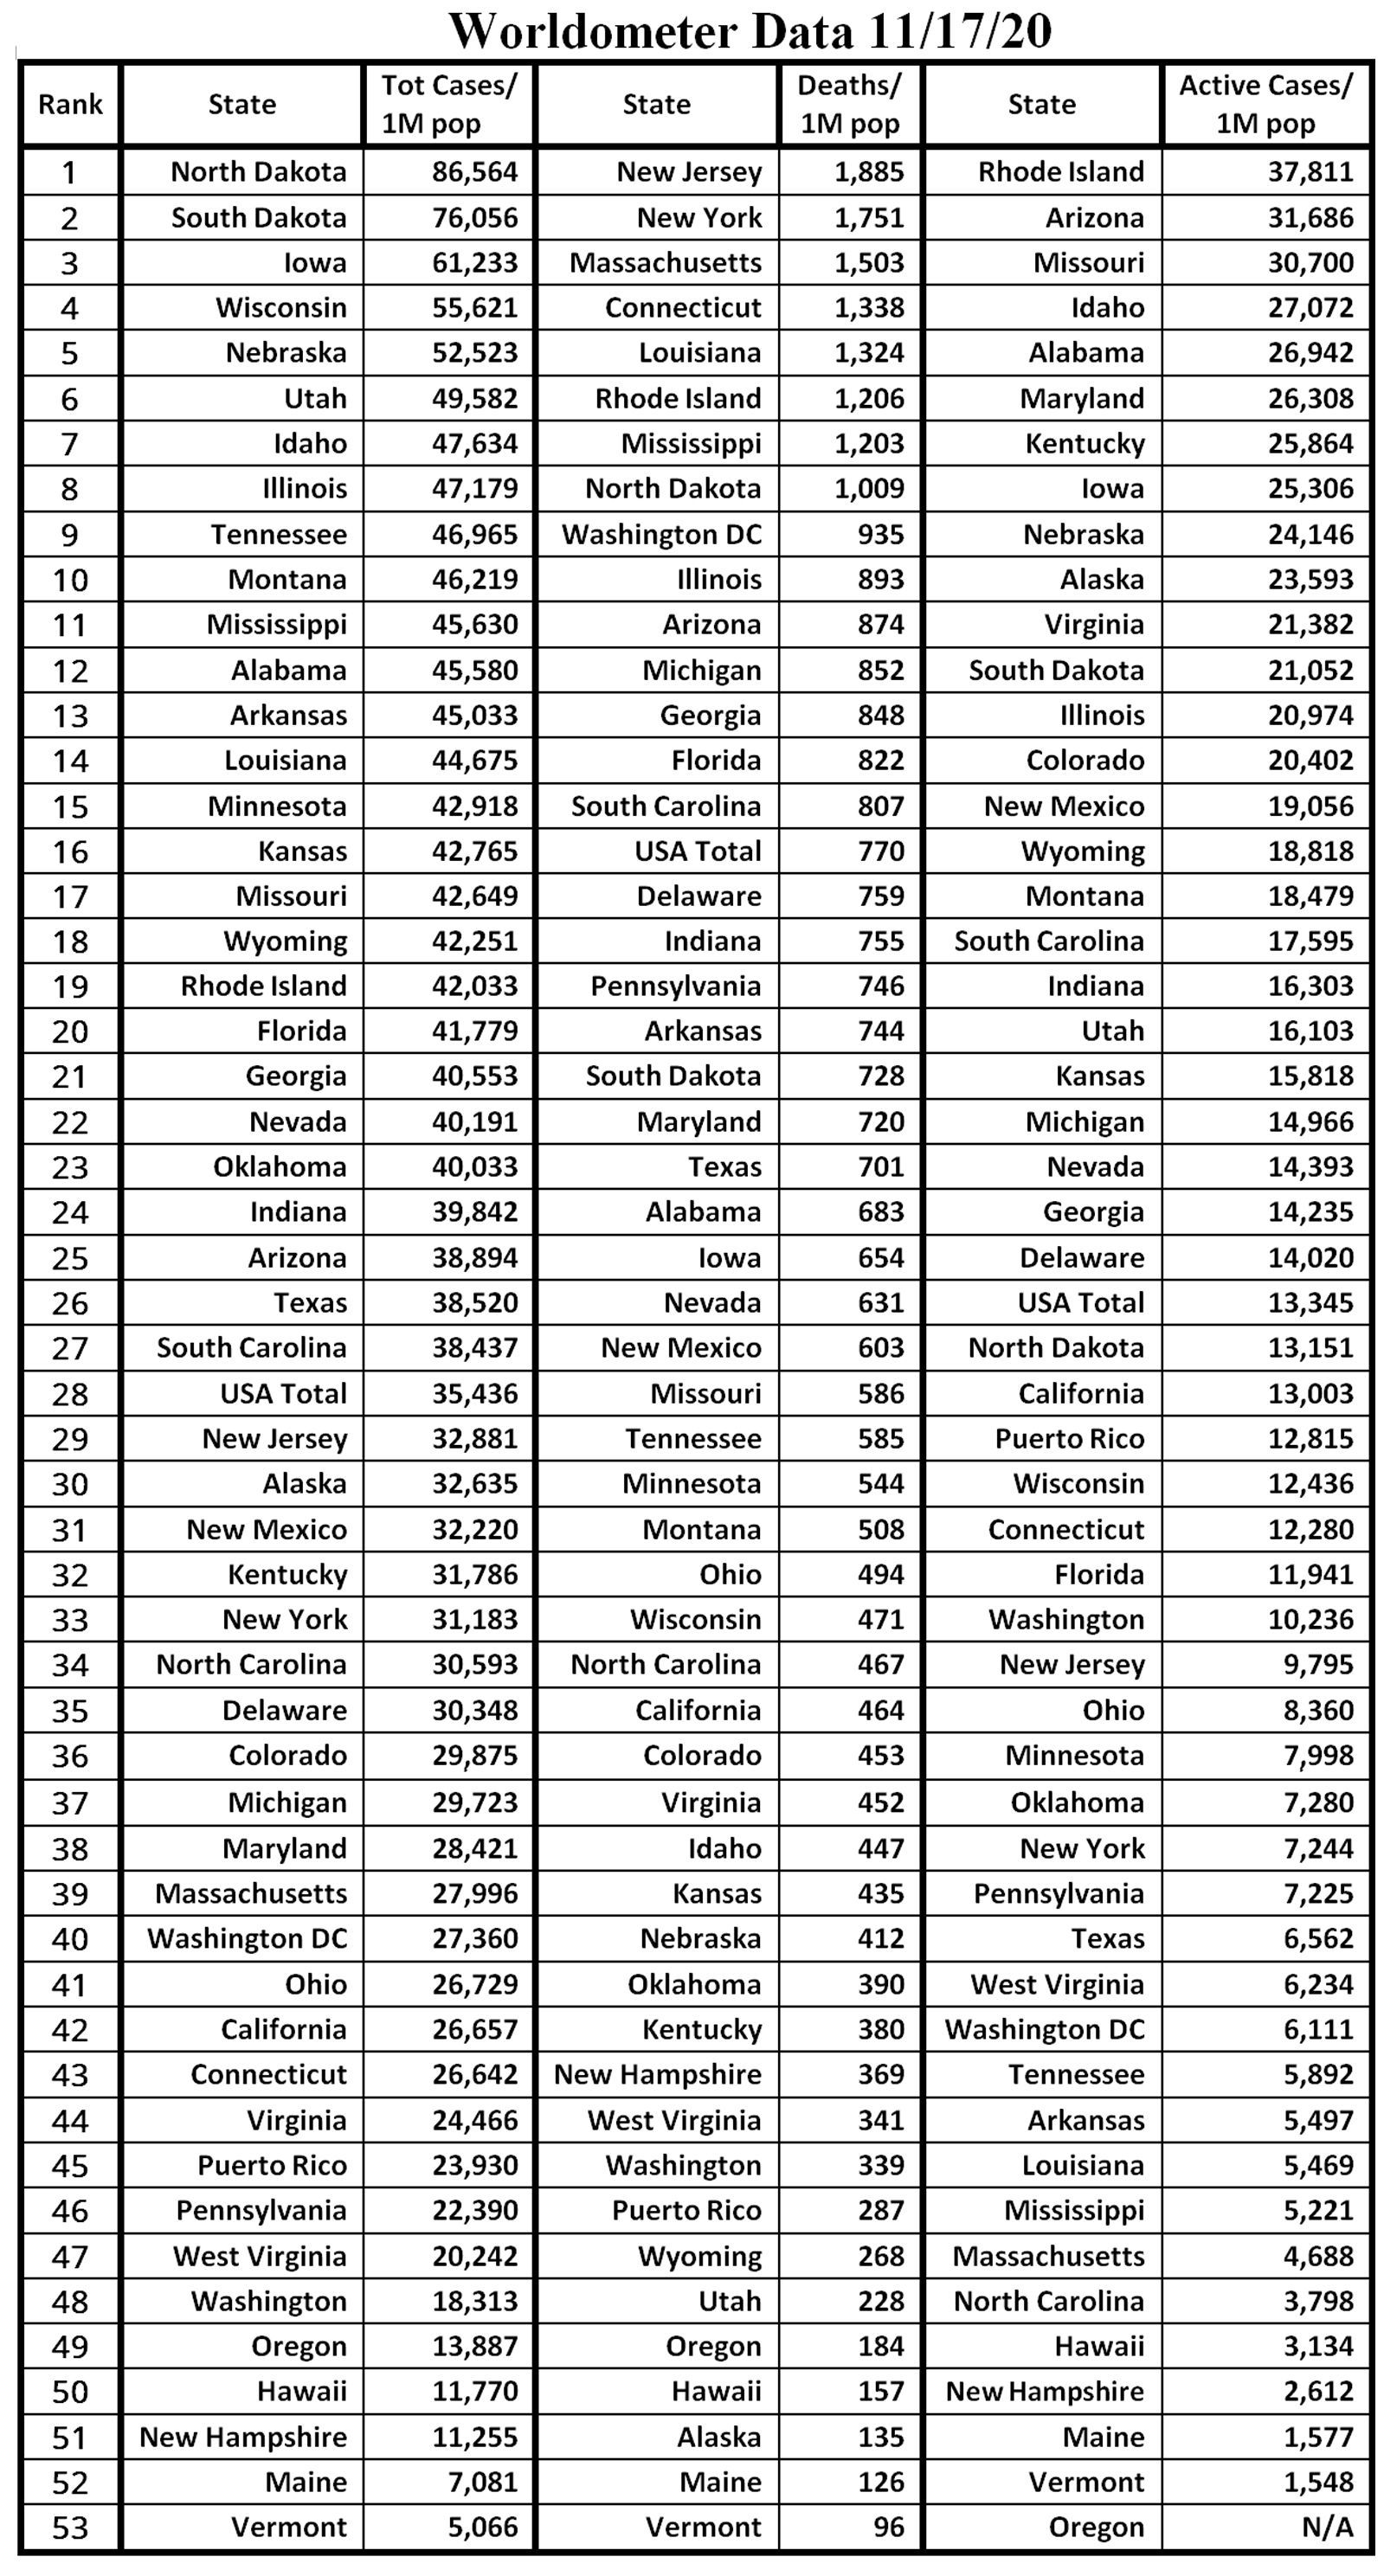
State Statistics
Country Statistics
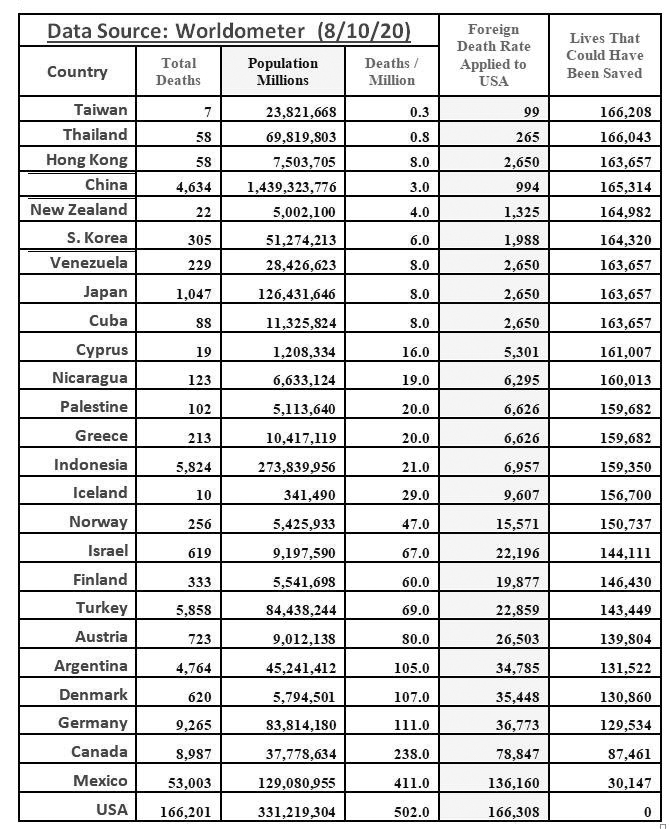
A few countries that have handled the Pandemic better than the US and the lives that could have been saved as of August 8 10, 2020 if Trump had followed their example and instituted a national pandemic policy.
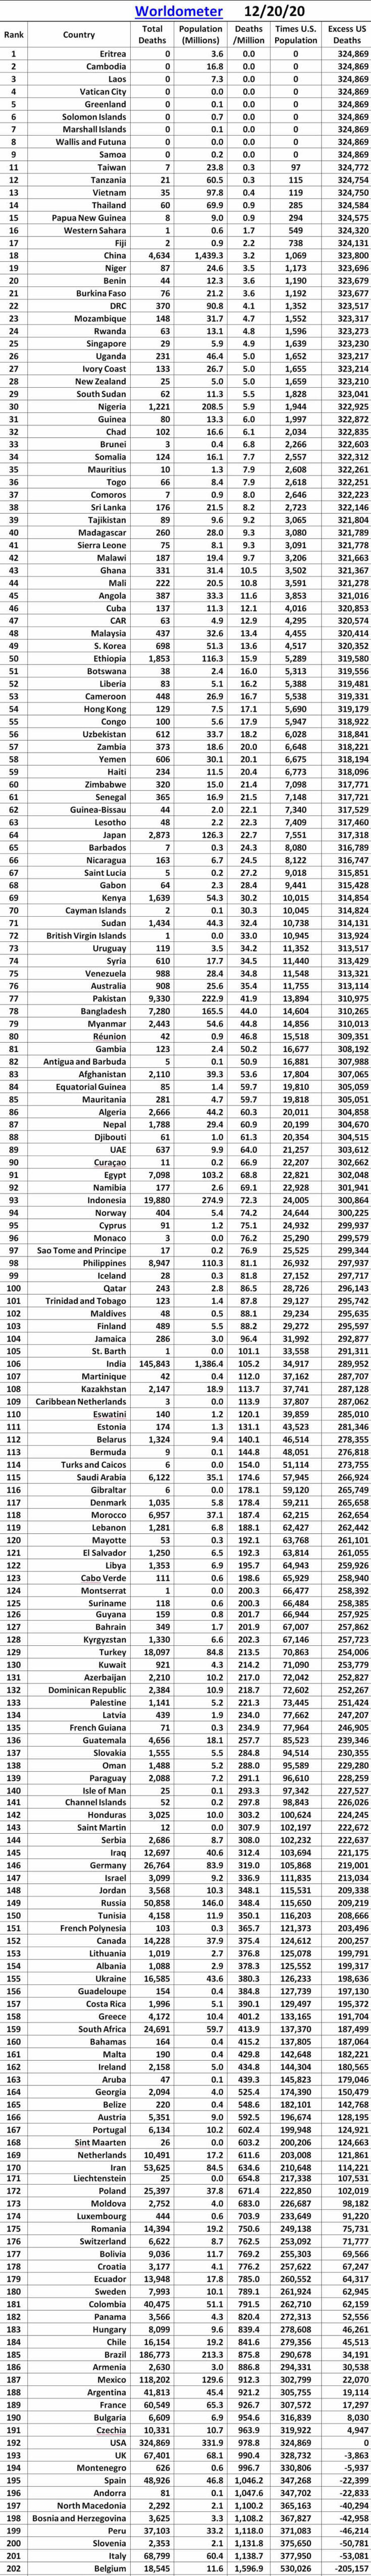
Rankings of countries throughout the world in handling the Coronavirus Pandemic and the lives that could have been saved as of December 20, 2020 if Trump had followed their example and instituted a national pandemic policy.:
Rankings of countries throughout the world in handling the Coronavirus Pandemic and the lives that could have been saved as of July, 2020 if Trump had followed their example and instituted a national pandemic policy.:
|
Rank |
Country |
Total |
Population (Millions) |
Deaths /Million |
Times U.S. Population |
Excess U.S. Deaths |
|
Deaths |
||||||
|
1 |
38 |
12.6 |
3 |
66 |
1,167,554 |
|
|
2 |
74 |
26.0 |
3 |
66 |
1,167,554 |
|
|
3 |
5,272 |
1,448.5 |
4 |
88 |
1,167,219 |
|
|
4 |
194 |
17.4 |
11 |
243 |
1,164,875 |
|
|
5 |
138 |
11.6 |
12 |
265 |
1,164,540 |
|
|
6 |
312 |
26.1 |
12 |
265 |
1,164,540 |
|
|
7 |
125 |
10.0 |
13 |
287 |
1,164,206 |
|
|
8 |
163 |
12.8 |
13 |
287 |
1,164,206 |
|
|
9 |
846 |
63.3 |
13 |
287 |
1,164,206 |
|
|
10 |
126 |
8.3 |
15 |
332 |
1,163,536 |
|
|
11 |
1,468 |
95.2 |
15 |
332 |
1,163,536 |
|
|
12 |
3,155 |
216.7 |
15 |
332 |
1,163,536 |
|
|
13 |
396 |
22.1 |
18 |
398 |
1,162,532 |
|
|
14 |
113 |
5.0 |
23 |
508 |
1,160,857 |
|
|
15 |
Bhutan |
21 |
0.8 |
27 |
597 |
1,159,518 |
|
16 |
Eritrea |
103 |
3.7 |
28 |
619 |
1,159,183 |
|
17 |
835 |
27.7 |
30 |
663 |
1,158,514 |
|
|
18 |
225 |
6.8 |
33 |
729 |
1,157,509 |
|
|
19 |
290 |
8.7 |
33 |
729 |
1,157,509 |
|
|
20 |
468 |
13.9 |
34 |
751 |
1,157,175 |
|
|
21 |
743 |
21.5 |
35 |
774 |
1,156,840 |
|
|
22 |
1,462 |
32.4 |
45 |
995 |
1,153,492 |
|
|
23 |
1,637 |
34.4 |
48 |
1,061 |
1,152,487 |
|
|
24 |
1,425 |
29.2 |
49 |
1,083 |
1,152,153 |
|
|
25 |
1,934 |
35.0 |
55 |
1,216 |
1,150,144 |
|
|
26 |
295 |
5.3 |
56 |
1,238 |
1,149,809 |
|
|
27 |
7,574 |
120.8 |
63 |
1,392 |
1,147,465 |
|
|
28 |
386 |
5.8 |
67 |
1,481 |
1,146,126 |
|
|
29 |
2,243 |
33.1 |
68 |
1,503 |
1,145,791 |
|
|
30 |
2,159 |
31.2 |
69 |
1,525 |
1,145,456 |
|
|
31 |
1,974 |
27.9 |
71 |
1,569 |
1,144,787 |
|
|
32 |
670 |
9.3 |
72 |
1,591 |
1,144,452 |
|
|
33 |
860 |
11.7 |
74 |
1,636 |
1,143,782 |
|
|
34 |
3,632 |
48.4 |
75 |
1,658 |
1,143,448 |
|
|
35 |
1,361 |
16.8 |
81 |
1,790 |
1,141,439 |
|
|
36 |
Guinea-Bissau |
177 |
2.1 |
86 |
1,901 |
1,139,765 |
|
37 |
Timor-Leste |
138 |
1.4 |
101 |
2,232 |
1,134,743 |
|
38 |
758 |
7.5 |
101 |
2,232 |
1,134,743 |
|
|
39 |
5,689 |
56.2 |
101 |
2,232 |
1,134,743 |
|
|
40 |
1,468 |
13.6 |
108 |
2,387 |
1,132,399 |
|
|
41 |
5,046 |
46.0 |
110 |
2,431 |
1,131,729 |
|
|
42 |
1,971 |
17.7 |
112 |
2,476 |
1,131,060 |
|
|
43 |
Equatorial Guinea |
183 |
1.5 |
122 |
2,697 |
1,127,712 |
|
44 |
Gabon |
307 |
2.3 |
132 |
2,918 |
1,124,364 |
|
45 |
2,686 |
20.2 |
133 |
2,940 |
1,124,029 |
|
|
46 |
30,661 |
229.5 |
134 |
2,962 |
1,123,694 |
|
|
47 |
Gambia |
372 |
2.6 |
145 |
3,205 |
1,120,011 |
|
48 |
6,881 |
45.4 |
152 |
3,360 |
1,117,668 |
|
|
49 |
3,165 |
19.4 |
163 |
3,603 |
1,113,985 |
|
|
50 |
29,463 |
167.9 |
175 |
3,868 |
1,109,967 |
|
|
51 |
Comoros |
161 |
0.9 |
177 |
3,912 |
1,109,297 |
|
52 |
3,056 |
17.2 |
178 |
3,934 |
1,108,963 |
|
|
53 |
Macao |
123 |
0.7 |
184 |
4,067 |
1,106,954 |
|
54 |
Djibouti |
189 |
1.0 |
186 |
4,111 |
1,106,284 |
|
55 |
7,933 |
40.8 |
195 |
4,310 |
1,103,271 |
|
|
56 |
5,856 |
29.3 |
200 |
4,421 |
1,101,597 |
|
|
57 |
997 |
4.9 |
203 |
4,487 |
1,100,593 |
|
|
58 |
4,062 |
19.5 |
209 |
4,619 |
1,098,584 |
|
|
59 |
Solomon Islands |
153 |
0.7 |
212 |
4,686 |
1,097,579 |
|
60 |
Qatar |
690 |
3.0 |
232 |
5,128 |
1,090,883 |
|
61 |
24,613 |
106.2 |
232 |
5,128 |
1,090,883 |
|
|
62 |
2,349 |
10.1 |
233 |
5,150 |
1,090,548 |
|
|
63 |
9,646 |
35.8 |
269 |
5,946 |
1,078,495 |
|
|
64 |
1,841 |
5.9 |
310 |
6,852 |
1,064,768 |
|
|
65 |
Lesotho |
723 |
2.2 |
332 |
7,338 |
1,057,403 |
|
66 |
19,494 |
55.2 |
353 |
7,802 |
1,050,372 |
|
|
67 |
21 |
0.1 |
369 |
8,156 |
1,045,015 |
|
|
68 |
5,709 |
15.3 |
372 |
8,222 |
1,044,010 |
|
|
69 |
531,913 |
1,406.6 |
378 |
8,355 |
1,042,002 |
|
|
70 |
4,384 |
11.1 |
397 |
8,775 |
1,035,640 |
|
|
71 |
12,031 |
30.2 |
398 |
8,797 |
1,035,306 |
|
|
72 |
16,297 |
37.8 |
431 |
9,526 |
1,024,257 |
|
|
73 |
43,206 |
99.0 |
437 |
9,659 |
1,022,248 |
|
|
74 |
2,991 |
6.7 |
445 |
9,836 |
1,019,570 |
|
|
75 |
34,371 |
70.1 |
490 |
10,830 |
1,004,503 |
|
|
76 |
161,879 |
279.1 |
580 |
12,820 |
974,371 |
|
|
77 |
Kuwait |
2,570 |
4.4 |
587 |
12,974 |
972,027 |
|
78 |
66,499 |
112.5 |
591 |
13,063 |
970,688 |
|
|
79 |
74,694 |
125.6 |
595 |
13,151 |
969,349 |
|
|
80 |
25,375 |
42.2 |
602 |
13,306 |
967,005 |
|
|
81 |
Mongolia |
2,179 |
3.4 |
645 |
14,256 |
952,609 |
|
82 |
4,230 |
6.6 |
646 |
14,278 |
952,274 |
|
|
83 |
229 |
0.3 |
663 |
14,654 |
946,582 |
|
|
84 |
35,111 |
51.3 |
684 |
15,118 |
939,551 |
|
|
85 |
13,848 |
19.2 |
721 |
15,936 |
927,163 |
|
|
86 |
8,530 |
11.3 |
754 |
16,666 |
916,115 |
|
|
87 |
7,118 |
9.4 |
755 |
16,688 |
915,780 |
|
|
88 |
16,880 |
21.6 |
782 |
17,284 |
906,740 |
|
|
89 |
19,005 |
23.9 |
796 |
17,594 |
902,053 |
|
|
90 |
Mauritius |
1,051 |
1.3 |
824 |
18,213 |
892,678 |
|
91 |
21,947 |
26.1 |
842 |
18,611 |
886,652 |
|
|
92 |
4,628 |
5.3 |
869 |
19,207 |
877,612 |
|
|
93 |
Bahrain |
1,566 |
1.8 |
878 |
19,406 |
874,599 |
|
94 |
6,437 |
7.0 |
914 |
20,202 |
862,546 |
|
|
95 |
4,567 |
4.9 |
932 |
20,600 |
856,519 |
|
|
96 |
Fiji |
885 |
0.9 |
973 |
21,506 |
842,792 |
|
97 |
10,285 |
10.3 |
999 |
22,081 |
834,088 |
|
|
98 |
5,404 |
5.3 |
1,011 |
22,346 |
830,070 |
|
|
99 |
Réunion |
921 |
0.9 |
1,014 |
22,412 |
829,065 |
|
100 |
5,600 |
5.5 |
1,016 |
22,456 |
828,396 |
|
|
101 |
11,116 |
10.2 |
1,088 |
24,048 |
804,290 |
|
|
102 |
20,215 |
18.6 |
1,088 |
24,048 |
804,290 |
|
|
103 |
Cyprus |
1,364 |
1.2 |
1,115 |
24,645 |
795,250 |
|
104 |
37,158 |
33.2 |
1,120 |
24,755 |
793,576 |
|
|
105 |
Botswana |
2,801 |
2.4 |
1,147 |
25,352 |
784,536 |
|
106 |
102,174 |
85.6 |
1,194 |
26,391 |
768,801 |
|
|
107 |
Jamaica |
3,566 |
3.0 |
1,195 |
26,413 |
768,466 |
|
108 |
Eswatini |
1,427 |
1.2 |
1,204 |
26,612 |
765,452 |
|
109 |
Albania |
3,602 |
2.9 |
1,257 |
27,783 |
747,708 |
|
110 |
22,992 |
17.2 |
1,336 |
29,529 |
721,258 |
|
|
111 |
12,575 |
9.3 |
1,348 |
29,795 |
717,240 |
|
|
112 |
14,122 |
10.3 |
1,371 |
30,303 |
709,540 |
|
|
113 |
53,046 |
38.4 |
1,382 |
30,546 |
705,857 |
|
|
114 |
8,758 |
5.8 |
1,501 |
33,176 |
666,015 |
|
|
115 |
Namibia |
4,091 |
2.6 |
1,553 |
34,326 |
648,605 |
|
116 |
Guyana |
1,299 |
0.8 |
1,636 |
36,160 |
620,817 |
|
117 |
10,936 |
6.7 |
1,636 |
36,160 |
620,817 |
|
|
118 |
14,452 |
8.8 |
1,647 |
36,403 |
617,134 |
|
|
119 |
102,595 |
60.8 |
1,689 |
37,332 |
603,072 |
|
|
120 |
146,301 |
86.0 |
1,701 |
37,597 |
599,054 |
|
|
121 |
10,012 |
5.6 |
1,802 |
39,829 |
565,239 |
|
|
122 |
9,081 |
5.0 |
1,809 |
39,984 |
562,895 |
|
|
123 |
9,402 |
5.2 |
1,814 |
40,095 |
561,221 |
|
|
124 |
13,819 |
7.6 |
1,817 |
40,161 |
560,217 |
|
|
125 |
22,392 |
12.0 |
1,867 |
41,266 |
543,477 |
|
|
126 |
Luxembourg |
1,232 |
0.6 |
1,918 |
42,393 |
526,401 |
|
127 |
Panama |
8,646 |
4.4 |
1,944 |
42,968 |
517,697 |
|
128 |
36,019 |
18.1 |
1,989 |
43,963 |
502,630 |
|
|
129 |
174,352 |
83.9 |
2,078 |
45,930 |
472,833 |
|
|
130 |
18,057 |
8.7 |
2,087 |
46,129 |
469,819 |
|
|
131 |
Uruguay |
7,634 |
3.5 |
2,184 |
48,273 |
437,343 |
|
132 |
Estonia |
3,001 |
1.3 |
2,270 |
50,173 |
408,550 |
|
133 |
24,536 |
10.2 |
2,401 |
53,069 |
364,691 |
|
|
134 |
29,423 |
12.0 |
2,442 |
53,975 |
350,964 |
|
|
135 |
22,542 |
9.1 |
2,486 |
54,948 |
336,232 |
|
|
136 |
334,336 |
131.6 |
2,541 |
56,163 |
317,818 |
|
|
137 |
167,642 |
65.6 |
2,556 |
56,495 |
312,796 |
|
|
138 |
112,418 |
43.2 |
2,603 |
57,534 |
297,060 |
|
|
139 |
121,760 |
46.7 |
2,606 |
57,600 |
296,055 |
|
|
140 |
26,927 |
10.1 |
2,655 |
58,683 |
279,650 |
|
|
141 |
19,969 |
7.3 |
2,733 |
60,407 |
253,535 |
|
|
142 |
399,715 |
145.8 |
2,741 |
60,584 |
250,857 |
|
|
143 |
142,861 |
51.5 |
2,773 |
61,291 |
240,143 |
|
|
144 |
130,527 |
46.0 |
2,837 |
62,706 |
218,715 |
|
|
145 |
Armenia |
8,751 |
3.0 |
2,945 |
65,093 |
182,556 |
|
146 |
34,376 |
11.7 |
2,946 |
65,115 |
182,222 |
|
|
147 |
Moldova |
12,124 |
4.0 |
3,021 |
66,773 |
157,111 |
|
148 |
Trinidad/Tobago |
4,390 |
1.4 |
3,121 |
68,983 |
123,631 |
|
149 |
190,868 |
60.3 |
3,167 |
70,000 |
108,230 |
|
|
150 |
119,632 |
37.7 |
3,170 |
70,066 |
107,225 |
|
|
151 |
704,320 |
215.4 |
3,271 |
72,298 |
73,410 |
|
|
152 |
227,524 |
68.5 |
3,322 |
73,426 |
56,335 |
|
|
153 |
64,497 |
19.3 |
3,350 |
74,045 |
46,960 |
|
|
154 |
Slovenia |
7,100 |
2.1 |
3,417 |
75,525 |
24,528 |
|
155 |
Latvia |
6,388 |
1.8 |
3,455 |
76,365 |
11,806 |
|
156 |
1,168,558 |
334.8 |
3,490 |
77,145 |
0 |
|
|
157 |
68,243 |
19.0 |
3,586 |
79,261 |
-32,054 |
|
|
158 |
37,089 |
10.3 |
3,595 |
79,460 |
-35,067 |
|
|
159 |
Lithuania |
9,692 |
2.7 |
3,641 |
80,476 |
-50,468 |
|
160 |
21,167 |
5.5 |
3,877 |
85,693 |
-129,482 |
|
|
161 |
42,811 |
10.7 |
3,987 |
88,124 |
-166,311 |
|
|
162 |
Georgia |
17,101 |
4.0 |
4,309 |
95,241 |
-274,118 |
|
163 |
Croatia |
18,276 |
4.1 |
4,502 |
99,507 |
-338,735 |
|
164 |
North Macedonia |
9,677 |
2.1 |
4,649 |
102,756 |
-387,952 |
|
165 |
Bosnia/Herzegovina |
16,352 |
3.2 |
5,032 |
111,221 |
-516,182 |
|
166 |
48,881 |
9.6 |
5,088 |
112,459 |
-534,931 |
|
|
167 |
38,437 |
6.8 |
5,616 |
124,130 |
-711,708 |
|
|
168 |
220,695 |
33.7 |
6,552 |
144,818 |
-1,025,086 |
|
|
War/Pandemic |
Deaths |
Population (Millions) |
Equals 1 Out of Every |
Deaths/Million |
Times 331 Million |
|||
|
Civil War |
655,000 |
31.4 |
48 |
20,859.9 |
6,904,618 |
|||
|
1918 Flue |
675,000 |
104.5 |
155 |
6,459.3 |
2,138,038 |
|||
|
Covid-19 |
1,168,558 |
334.8 |
286.5 |
3,490.3 |
1,155,277 |
|||
|
World War II |
405,399 |
134.9 |
333 |
3,005.2 |
994,715 |
|||
|
World War I |
116,516 |
103.2 |
886 |
1,129.0 |
373,709 |
|||
|
Vietnam War |
58,209 |
165.9 |
2,850 |
350.9 |
116,137 |
|||
|
Korean War |
36,516 |
152.3 |
4,171 |
239.8 |
79,362 |
|||
|
Iraq War |
4,497 |
290.1 |
64,510 |
15.5 |
5,131 |
|||
|
Afghanistan War |
2,216 |
285.0 |
128,610 |
7.8 |
2,574 |
|||
|
Gulf War |
294 |
246.8 |
839,456 |
1.2 |
394 |
|||
|
Sum of deaths in all 20th century wars = |
623,647 |
|||||||