![]()
![]()
![]()
![]()
![]()
![]()
Understanding the Federal Budget
Chapter 4: Welfare, Tax Expenditures, and Redistribution
This eBook is available at Amazon.com for a $2.99 contribution to this website.
There is no separate account for welfare in the federal budget. As a result, there is no official definition of a welfare program. One way to identify a welfare program is to simply assume that all social-insurance programs are welfare. While some people think this way, people in general see most social-insurance programs as insurance, not welfare, and reject the idea that programs such as Social Security and Medicare are welfare. They view these programs as programs they pay for through taxes, and since they pay for them, they do not consider them to be welfare.
This leads to a problem in defining any social-insurance program as welfare in that all social-insurance programs are paid for through taxes—even those programs that do not have a specific tax associated with them. Since these programs provide insurance throughout an individual’s lifetime, not just at a particular point in time, almost everyone pays the taxes that support social-insurance programs at some point in their lives. Even those individuals who do not pay taxes while they are receiving benefits either paid the taxes that supported the program before they began receiving benefits, or they will eventually end up paying those taxes at some point in the future after they are no longer in need of the program. Only those who are seriously disabled or otherwise unable to earn an income throughout their entire life are able to take advantage of social insurance without having to eventually pay the taxes needed to support social-insurance programs. Even then, the family members of those individuals generally pay the taxes that support these programs.
A generally accepted way to draw the distinction between welfare and non-welfare social-insurance is to assume those programs that are means tested—that is, that are specifically designed to benefit the less fortunate within our society—are considered to be welfare in spite of the fact that almost all of the beneficiaries pay the taxes that support these programs either before or after they receive benefits from them, and the family members of the recipients pay the taxes that support these programs as well. Social Security, Medicare, and unemployment compensation, for example, are not welfare programs under this definition since the benefits of Social Security and Medicare are not means tested and are available to all who qualify, whether they be rich or poor, as are unemployment compensation benefits. At the same time, there are a number of social-insurance programs that are means tested, the benefits of which are available only to the indigent or otherwise poor and are specifically designed to provide benefits to those who are less well off within society. These are the programs we will examine in this chapter, namely, means-tested programs that provide either cash or non-cash benefits.
Federal Welfare Programs
The federal programs that are means tested in the Office of Management and Budget’s Table 11.3—Outlays for Payments for Individuals are listed in Table 4.1 along with the percentages of GDP and of the federal budget each program represented in 2013.
Table 4.1: Federal Welfare Programs and Expenditures, 2013.
Program (2013)
Billions of
DollarsPercent of
GDPPercent of
Budget$282.4
1.70%
8.17%
$9.5
0.06%
0.27%
$265.4
1.60%
7.68%
$4.3
0.03%
0.12%
$3.2
0.02%
0.09%
$44.9
0.27%
1.30%
$39.3
0.24%
1.14%
$109.6
0.66%
3.17%
$82.5
0.50%
2.39%
$19.3
0.12%
0.56%
$6.6
0.04%
0.19%
$1.1
0.01%
0.03%
$172.5
1.04%
4.99%
$50.3
0.30%
1.46%
$21.2
0.13%
0.61%
$3.5
0.02%
0.10%
$57.5
0.35%
1.66%
$5.0
0.03%
0.15%
$5.2
0.03%
0.15%
$6.8
0.04%
0.20%
$21.6
0.13%
0.63%
$0.2
0.00%
0.00%
$1.2
0.01%
0.04%
$648.6
3.90%
18.78%
Source: Office of Management and Budget. (11.3 10.1)
Total expenditures on these programs (Total Welfare) are plotted in Figure 4.1 from 1940 through 2013 along with a breakdown of these expenditures on the basis of whether they provide cash (Cash Welfare) or non-cash (Non-Cash Welfare) assistance.
Source: Office of Management and Budget. (11.3 3.2 10.1)
As is indicated in this figure, Total Welfare expenditures were relatively stable from 1952 through1965 and then began to grow in response to Johnson’s War on Poverty, increasing from 4.7% of the budget and 0.78% of GDP in 1965 to 18.8% of the budget and 3.90% of GDP in 2013.
When we examine the breakdown between Cash Welfare and Non-Cash Welfare assistance we find that Non-Cash Welfare increased from 0.74% of the budget and 0.12% of GDP in 1965 to 14.1% of the budget and 2.9% of GDP in 2013 while Cash Welfare increased from 3.9% of the budget and 0.65% of GDP to 4.7% of the budget and 0.98% of GDP. This means that the increase in Non-Cash Welfare accounted for 90% of the 302% increase in Total Welfare expenditures since 1965 and Cash Welfare accounted for only 10% of that increase.
Cash Welfare Programs
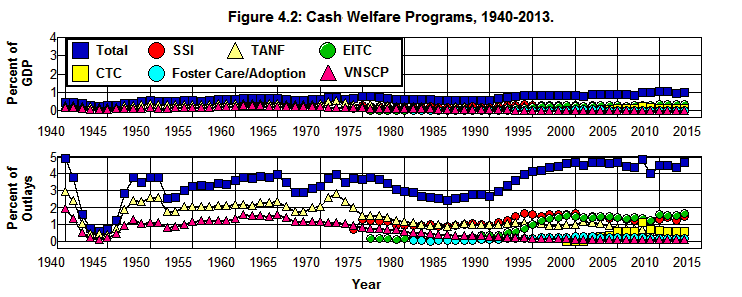
Expenditures on the seven Cash Welfare Programs listed in Table 4.1 are plotted from 1940 through 2013 in Figure 4.2 where SSI is the Supplemental security income program in Table 4.1, TANF is Family support payments to States and TANF, EITC is Earned income tax credit, CTC is Payment where child credit exceeds tax liability (i.e., the Child Tax Credit), Foster Care/Adoption is Payments to States—Foster Care/Adoption Assist., and VNSCP is Veterans non-service connected pensions. The rest of the programs in Table 4.1 are non-cash assistance programs that pay for or provide specific, in kind benefits such as food, housing, education, medical care, daycare, etc.
Source: Office of Management and Budget. (11.3 3.2 10.1)
As is shown in this figure, Total expenditures on Cash Welfare Programs varied between 2.4% and 3.9% of the budget and between 0.54% and 0.78% of GDP from 1950 through 2013, and amounted to some 4.71% of the budget and 0.98% of GDP in 2013. Expenditures on these programs reached their low point in 1985 and began to increase quit dramatically during the 1990-1991 recession and continued to increase throughout the 1990s. The increase the 1990s reflects the fundamental changes that took place in our welfare system with 1) the expansion of the Earned income tax credit (EITC) program that was created in 1976, 2) the welfare reform legislation of 1996, and 3) the introduction of the Payment where child credit exceeds tax liability (CTC) program in 1999.
Prior to 1977, virtually all of the money a cash-welfare recipient earned through employment was subtracted from the amount of assistance he or she received. This created a situation in which there was very little incentive for a welfare recipient to accept a job that paid less than his or her cash-welfare benefits since accepting such a job would not lead to a significant increase the recipient's income. This situation was changed with the introduction of the Earned income and Child Tax Credits combined with the replacement of the Aid to Dependent Children program with TANF (Temporary Assistance to Needy Families). Since the benefits of TANF are, with exceptions, tied to the willingness of the recipient to find work, and the Earned income and Child Tax Credits are refundable (that is, are paid to the recipient even if the recipient owes no taxes so long as he or she is employed) the effect of these changes is to encourage cash-welfare recipients to seek employment since the benefits of these programs (with exceptions) are only available to those who are employed or who are participating in an employment training program.
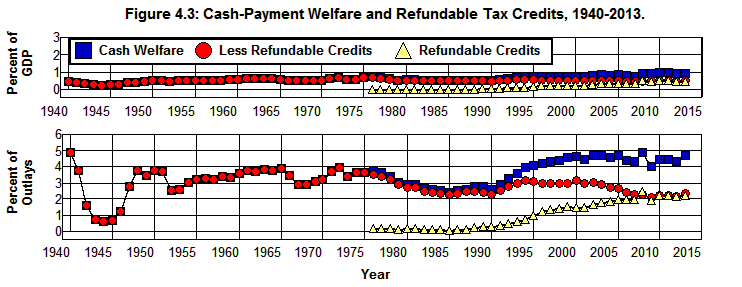
The way in which these welfare reforms have affected the cash-welfare payments by the federal government can be seen in Figure 4.3 where in this figure: Cash Welfare is the total of all cash-welfare payments made by the federal government; Refundable Credits is the amount of money spent by the federal government on the Earned income and Child Tax Credit programs, and Less Refundable Credits is obtained by subtracting Refundable Credits from Cash Welfare.
Source: Office of Management and Budget. (11.3 3.2 10.1)
As can be seen in this figure, by 2013 almost half (49%) of all federal Cash Welfare expenditures took the form of Refundable Credits, and even though Cash Welfare had increased by 20% as a fraction of the budget and by 49% as a fraction of GDP since 1965, the amount of federal Cash Welfare expenditures that were not tied directly to work through Refundable Credits had fallen by 39% as a fraction of the budget and by 23% as a fraction of GDP by 2013. It is also worth noting that an additional 13% of cash-payment expenditures were made through the Family support payments to States and TANF (TANF) program which has a work requirement (with exceptions) associated with it. That means that 62% of all cash-assistance expenditures in 2013 were made through programs designed to encourage work and to assist the working poor.
When we look at the expenditures on the individual cash-assistance programs in 2013 we find that
1.66% of the federal budget and 0.35% of GDP went to the Earned income tax credit (EITC) program to “provide an incentive to work.”
Non-Cash Welfare Programs
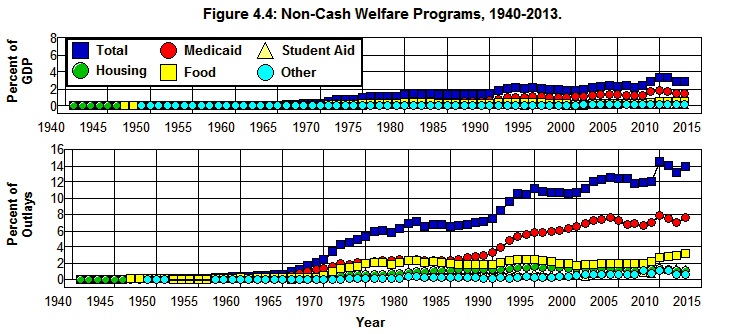
As was noted above, all but the six programs plotted in Figure 4.2 are non-cash assistance programs that pay for or provide specific, in kind benefits. Here we are talking about Children's health insurance, Medicaid, Indian health, Health resources and services, Substance abuse and mental health services, Student assistance—Department of Education and other, Housing assistance, SNAP (formerly Food stamps) (including Puerto Rico), Child nutrition and special milk programs, Supplemental feeding programs (WIC and CSFP), Low income home energy assistance, Payments to States for daycare assistance, and Other public assistance in Table 4.1.[24]
Expenditures on these programs are plotted from 1940 through 2013 in Figure 4.4 where in this figure: Total is the sum of all federal expenditures on non-cash assistance programs listed above; Medicaid is all expenditures on Medicaid; Student Aid is expenditures on Student assistance—Department of Education and other; Housing is expenditures on Housing assistance; Food is all Food and nutrition assistance expenditures, and Other is the sum of the total expenditures on all of the rest of the non-cash assistance programs listed in Table 4.1 combined.
Source: Office of Management and Budget. (11.3 3.2 10.1)
It is clear from this figure that the Total expenditures on Non-Cash Welfare programs have increased dramatically since the 1960s, going from 0.74% of the budget and 0.12% of the economy in 1965 to 14.1% of the budget and 2.92% of the economy in 2013. It is also clear from Figure 4.4 that the reason Non-Cash Welfare programs dominate our welfare system in Figure 4.1 in that the Medicaid program amounted to 7.68% of the budget in 2013 and 1.60% of the economy and, thus, accounted for 41% of all welfare expenditures in 2013 and 55% of all expenditures on Non-Cash Welfare programs. The second largest category is Food (Food and nutrition assistance) which went from 0.25% of the budget and 0.04% of GDP in 1965 to 3.17% of the budget and 0.66% of GDP in 2013. None of the Non-Cash Welfare programs included in Other exceeded 2% of the budget or 0.4% of the economy in 2013.
When we look at the expenditures on the individual programs in 2013, we find that
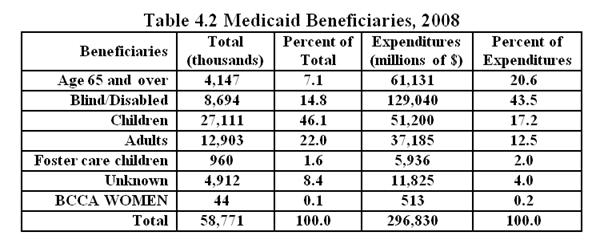
What about Medicaid? Where did the 7.68% of the federal budget and 1.6% of gross income earned in 2013 that went to Medicaid go? The distribution of Medicaid benefits is given in the Census Bureau’s Table 151. Medicaid—Beneficiaries and Payments: 2000 to 2009. The distribution of Medicaid benefits from this table for 2008 is presented in Table 4.2.
Source: Census Bureau (151)
Table 4.2 shows that 76% of the known beneficiaries of the Medicaid program in 2008 were poor Children, Blind/Disabled individuals, or indigent elderly adults Age 65 and over, and over 87% of Medicaid’s expenditures that were classified went to these individuals. Of the 58.8 million Medicaid beneficiaries, only 22% were identified as indigent Adults who were not Blind/Disabled or under Age 65 and over, and only 13% of Medicaid’s benefits went to these Adults. In other words, less than 1% of the federal budget was spent on Medicaid benefits that went to recipients identified as adults who were not blind, disabled, or under age 65.
Entitlements and Welfare
Entitlement's programs are programs that guarantee, by law, specified benefits to anyone who qualifies for the benefits offered by the program. An entitlement program may or may not be means-tested and, therefore, may or may not be a form of welfare. Social Security, for example, is an entitlement program that is not a welfare program since its benefits are guaranteed by law to anyone who qualifies irrespective of income or wealth.
By the same token, the benefits of a welfare program may or may not be guaranteed by law and, therefore, may or may not be an entitlement program. The federal Section 8 Housing program, for example, is means-test and, therefore, is a welfare program, but the benefits of this program are not guaranteed by law to anyone who qualifies. Instead, a fixed amount of money is allocated to this program, and those who qualify who are not receiving benefits are put on a waiting list and will receive benefits only if and when the money becomes available. The following is a list of federal entitlement programs that are means-tested:[25]
• Special milk program
• SNAP (formerly the Food Stamp Program)
• Child Nutrition Programs
• Grants to States for Medicaid
• Children’s Health Insurance Program
• Child Enrollment Contingency Fund
• Payments to States for Child Support Enforcement and Family Support Programs
• Temporary Assistance for Needy Families
• Payment Where Adoption Credit Exceeds Liability for Tax
• Payments to States for Foster Care and Adoption Assistance
• Child Care Entitlement to States
• Payment Where Recovery Rebate Exceeds Liability for Tax
• Payment Where Earned Income Credit Exceeds Liability for Tax
• Payment Where Saver’s Credit Exceeds Liability for Tax
• Health insurance supplement to earned income credit
• Payment Where Child Credit Exceeds Liability for Tax
• Payment Where Credit to Aid First-Time Homebuyers Exceeds Liability for Tax
• Payment Where American Opportunity Credit Exceeds Liability for Tax
• Payment Where Making Work Pay Credit Exceeds Liability for Tax
• Supplemental Security Income Program (SSI)
• Housing Trust Fund
• Veterans’ Pensions benefits
• Refundable Premium Assistance Tax Credit
• Reduced Cost Sharing for Individuals Enrolling in Qualified Health Plans
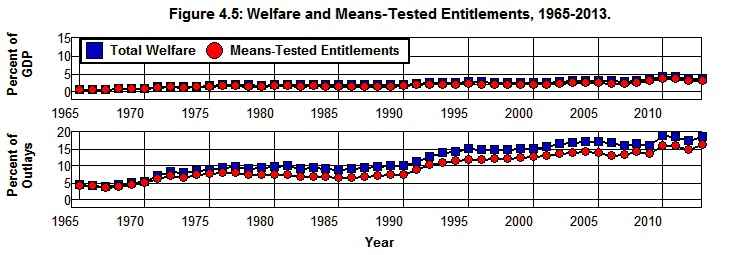
Figure 4.5 shows the relationship between means-tested entitlement expenditures (Means-Tested Entitlements) and total welfare expenditures (Total Welfare) from 1965 through 2013. While it is clear from this figure that welfare spending is dominated by entitlements in the federal budget—87% of all welfare spending was through Means-Tested Entitlements in 2013—the extent to which this is so has varied over the years from over 95% of federal welfare expenditures in the early 1960s to a low of 73% in 1986.
Source: Office of Management and Budget. (8.1 10.1 11.3)
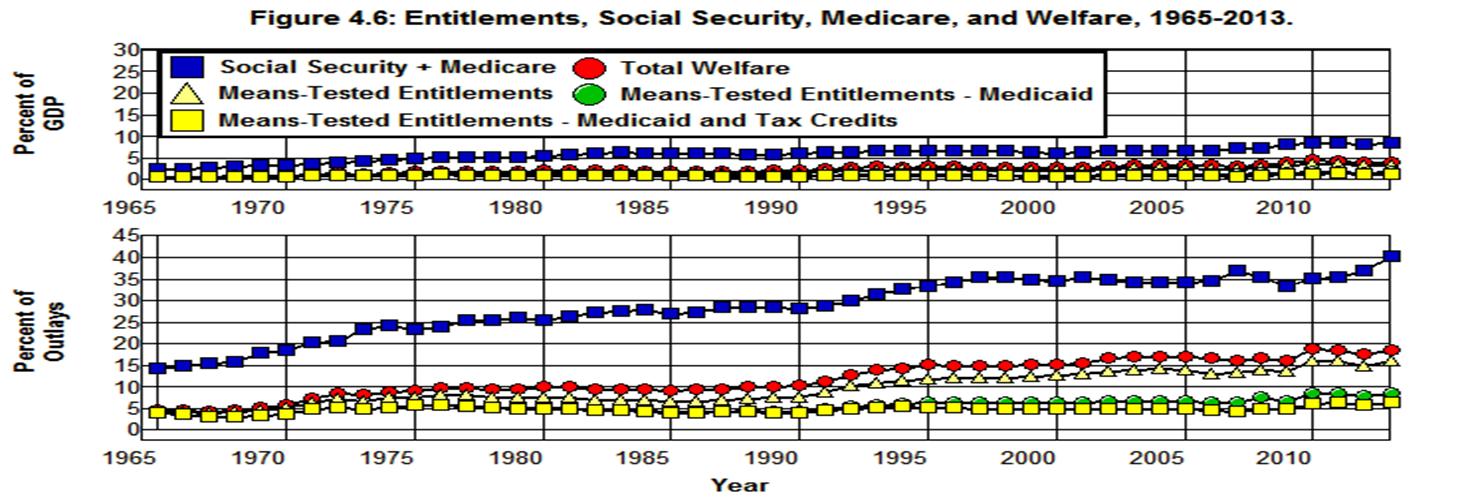
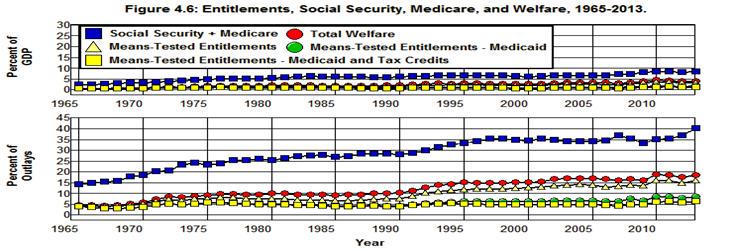
Figure 4.5 also shows how the sum of Means-Tested Entitlements has grown from 1965 through 2013—from 4.4% of the federal budget and 0.73% of the economy in 1965 to 16.3% of the federal budget and 3.39% of the economy by 2013. The real story of Means-Tested Entitlements, however, is told in Figure 4.6 which shows what the growth of Means-Tested Entitlements and Total Welfare expenditures look like with and without Medicaid and refundable tax credits included in the total. This figure also shows how means-tested entitlements compare to the two largest entitlement programs, Social Security and Medicare.
Source: Office of Management and Budget. (8.1 11.3 10.1)
Just as it is clear that Medicaid dominates the Non-Cash Welfare programs in Figure 4.4, it is clear from Figure 4.6 that Medicaid dominates the means-tested entitlement programs as well. Medicaid was enacted into law in 1965, and by 2013 it accounted for 47% of all government expenditures on means-tested entitlements. Whereas expenditures on non-Medicaid, means-tested entitlements (Means-Tested Entitlements less Medicaid) increased by 159% percent of the economy over that 42 year period, because of Medicaid, the sum of all means-tested entitlements (Means-Tested Entitlements) increased by 364% while Means-Tested Entitlements less Medicaid & Tax Credits increased only 90% over this same period. In other words, 77% of the growth in means-tested entitlements from 1965 through 2013 was in the Medicaid and refundable tax credits programs and non-Medicaid, non-tax-credit entitlements accounted for only 23% of the increase.
Figure 4.6 also makes it possible to compare the growth of means-tested entitlements from 1965 through 2013 with the sum of the two largest non-means-tested entitlement programs—Social Security and Medicre (Social Security plus Medicare). While means-tested entitlements were growing from 4.4% of the budget and 0.73% of the economy in 1965 to 16.3% of the budget and 3.39% of the economy by 2013, the non-means-tested Social Security and Medicare entitlement programs were growing from 14.5% of the budget and 2.4% of the economy to 40.3% of the budget and 8.37% of the economy. This, of course, is no surprise since we saw in Chapter 3 that Social Security stood at 23.4% of the budget in 2013 and 4.9% of the economy and that Medicare was at 16.9% of the budget and 3.51% of the economy in that year.
Tax-Expenditure Entitlements
As we have seen, 4.7% of the federal budget and 0.98% of GDP went to cash-payment welfare programs in 2013, and an additional 14.1% of the budget and 2.9% of GDP went to non-cash welfare programs. These programs have the effect of redistributing income from the general taxpayer to those who are less fortunate within society. It is important to recognize, however, that welfare programs are not the only way the federal government redistributes income. It also redistributes income through its power to tax.
According to the Joint Committee on Taxation there were over 200 provisions in the federal tax code in 2007 that provided "a special exclusion, exemption, or deduction from gross income or which provide a special credit, a preferential rate of tax, or a deferral of tax liability." Such provisions, which are generally referred to as tax breaks or loopholes, are “designed to encourage certain kinds of behavior by taxpayers or to aid taxpayers in special circumstances . . . [and] may, in effect, be viewed as spending programs channeled through the tax system.” Since the benefits of these "spending programs channeled through the tax system" are guaranteed by law to all who qualify they are, in fact, entitlement programs.
Tax-expenditure entitlement programs play an important role in redistributing income from the general taxpayer to various income groups within our society.
Tax Expenditures and the Redistribution of Income
The Joint Committee on Taxation estimated that the total of federal tax expenditures came to more than $1,035 billion in 2007 and that approximately 10% of the benefits of these tax expenditures went to corporations or other businesses and 90% to individuals. These estimates are gross estimates in that they only consider how particular tax expenditures benefit taxpayers directly without considering how eliminating that expenditure would interact with other tax provisions that affect taxpayers. Nor do they take into consideration how these interactions would affect taxpayers if groups of tax expenditures were eliminated.
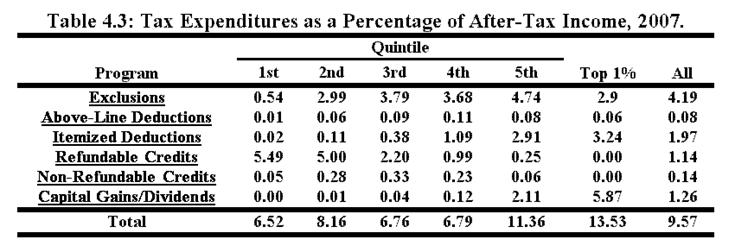
Leonard Burman, Eric Toder, and Christopher Geissler at the Tax Policy Center of the Urban Institute and Brookings Institution have examined these interaction effects for the 90% of tax expenditures that benefited individuals and have provided estimates of the way in which eliminating these tax expenditures would affect (or how the creation of these tax expenditures has affected) the after-tax income of various income groups after taking these interactions into account. These estimates for six major categories of tax expenditures are summarized in Table 4.3.
Source: Burman, Toder, and Geissler.
This table shows the extent to which after-tax income in each quintile (20%) and the top 1% of the income distribution would be reduced—after adjusting for the interactions between tax expenditures within each category—if each of the six categories of tax expenditures were eliminated as well as if all tax expenditures (Total) were eliminated.
Given the estimates of average after-tax income provided by the Congressional Budget Office for each income group and the number of households in each group provided by the Census Bureau, Table 4.3 makes it possible to calculate the average and total benefits received by each income group from each category of tax expenditure in this table as well as the benefits received by each income group from all tax expenditures combined.[26]
Tax Expenditures versus Welfare
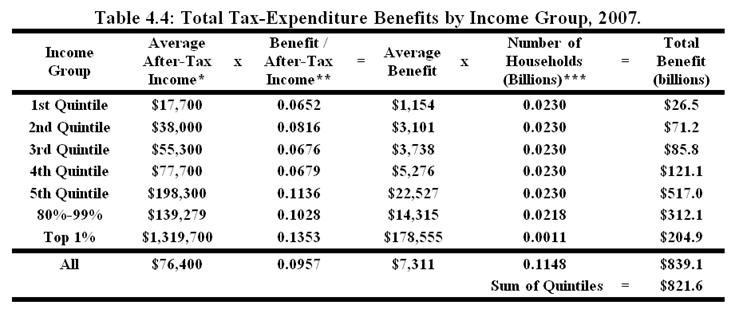
In examining Table 4.3 it is apparent that the bulk of the redistribution of income brought about by tax expenditures is from the general taxpayer to the top of the income distribution. The extent to which this is so can be seen in Table 4.4 which shows the average and total benefits received by each income group from all tax expenditures.[27]
Source: *Congressional Budget Office, **Burman et al., ***Census Bureau.
It is clear from this table that tax expenditures definitely do not have the effect of redistributing income from the general taxpayer to the poor, but, rather, have the effect of redistributing income from the general taxpayer to the top of the income distribution. In terms of real money, the $22,527 Average Benefit from all tax expenditures that went to the top 20% of the income distribution in 2007 was almost 20 times greater than the $1,154 Average Benefit that went to the bottom 20% and 6 times greater than the $3,738 Average Benefit that went to the middle 20%.
By the same token, the $178,555 Average Benefit that went to the Top 1% was 155 times greater than the $1,154 Average Benefit that went to the bottom 20%, 48 times greater than the $3,738 Average Benefit that went to the middle 20%, and almost 8 times greater than the $22,527 Average Benefit that went to the top 20% which, of course, includes the Top 1%.
When we exclude the Top 1% from the top 20% we find that the Average Benefit of the remaining 19% of the income distribution (80%-99%) was only $14,315 in 2007.[28] This is less than 1/12 of the Average Benefit of the Top 1% and is only 3.8 and 12.5 times the Average Benefit of the middle and bottom quintiles, respectively, compared to the 48 and 155 ratios for the Top 1% relative to these quintiles.
Of particular interest, however, is the fact that when we compare the absolute magnitude of the Total Benefit received by the various income groups in 2007 we find that the $517.0 billion that went to the top 20% of the income distribution was $77.6 billion greater than the entire $444.3 billion the federal government spent on welfare in that year.
It is also worth noting that the $204.9 billion Total Benefit that went to the Top 1% of the income distribution in 2007—enough to provide an average benefit of $178,555 for each member of the Top 1% in that year—was
In fact, the $204.9 billion in tax-expenditure Total Benefits that went to the Top 1% of the income distribution in 2007 that provided an Average Benefit of $178,555 for members of the Top 1% of the income distribution in 2007 was more than enough to pay for all of the above welfare programs combined plus the
with $7.3 billion left over in change.
In other words, the $204.9 billion the Top 1% of the income distribution saved in taxes as a result of the tax-expenditure entitlement benefits that are built into the tax code was enough to fund all of the federal government's welfare programs except the $190.6 billion spent on Medicaid and the $54.4 billion spent on that portion of Refundable Credits the federal government actually spent on refunds, and, as was noted above, the Total Benefit from tax expenditures that went to the Top 1% and top 80%-90% combined was enough to fund all of the welfare programs, including Medicaid and Refundable Credits, with $77.6 billion to spare. That $77.6 billion, in itself, was enough to give an average benefit of $3,374 to the Top 20% of the income distribution which is almost three times the $1,200 average benefit received by food stamp recipients in 2007.
Summary and Conclusions
Total welfare expenditures in 2007 amounted to $444.3 billion, virtually all of which redistributed income from the general taxpayer to the bottom 40% of the income distribution. Table 4.3 indicates that in 2007 the tax expenditure entitlement system redistributed $97.7 billion from the general taxpayer to the bottom 40% of the income distribution and redistributed $638.1 billion from the general taxpayer to the top 40% of the income distribution. The $540.4 billion difference for the top 40% from the tax-expenditure entitlement system exceeded the $444.3 billion worth of welfare expenditures that went to the bottom 40% by $99.3 billion. Thus, it would appear that the net effect of the federal government’s welfare and tax-expenditure entitlement systems combined in 2007 was to redistribute $99.3 billion from the general taxpayer to the top 40% of the income distribution.
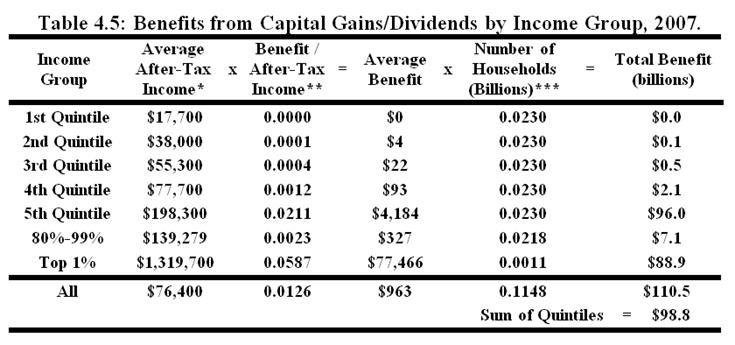
It is also worth noting that the Top 1% of the income distribution received a $77,466 Average Benefit the from the single tax-expenditure entitlement category Capital Gains/Dividends in Table 4.3. (See Table 4.5 in the appendix at the end of this chapter.) This single average benefit far exceeded the Average Benefit in Table 4.4 from all tax expenditures combined for any other income group. The next closest was that of the 80%-99% income group with a total Average Benefit from all tax expenditures of $14,315. It is also worth noting that the $88.9 billion in Total Benefit the Top 1% received from the Capital Gains/Dividends tax-expenditure entitlement program in 2007 was equal to the sum of the
It is fairly safe to say that the $77,466 Average Benefit the Top 1% received from this single tax-expenditure entitlement far exceeded any cash welfare benefit ever received by anyone on welfare.
The special treatment of Capital Gains/Dividends in the tax code is, clearly, a far more lucrative entitlement program for the wealthy than any government program available to the poor. [29]
Appendix on Tax Expenditures
This appendix examines the way in which the benefits from the Exclusions, Above-line deductions, Itemized Deductions, Refundable Credits, Non-Refundable Credits, and of Capital Gains/Dividends categories of tax expenditures listed in Table 4.3 are distributed among the various income groups.
Capital Gains/Dividends
Most capital gains were taxed at a maximum tax rate of 15% in 2007, rather than at the rates that apply to other forms of taxable income, and qualified dividends were taxed at the same rates as capital gains. [30] The average and total benefit implicit in Table 4.3 that were received by each income group in 2007 from Capital Gains/Dividends are shown in Table 4.5.
Source: *Congressional Budget Office, **Burman et al., ***Census Bureau.
This table shows the way in which Capital Gains/Dividends, the third largest category of tax expenditures and the category that benefited the Top 1% the most, redistributed income from the general taxpayer to the various income groups within society.
Here we find that none of the $98.8 billion of Total Benefit from Capital Gains/Dividends went to the poorest quintile while some $96.0 billion (97%) went to the richest quintile with an Average Benefit of $4,184. If we break down the richest quintile we find that 93% ($88.9 billion) of the $96.0 billion worth of Total Benefit that went to the top 20% of the income distribution, in fact, went to the Top 1% with an Average Benefit of $77,466. The largest beneficiary of the Capital Gains/Dividends tax-expenditure entitlement in terms of Average Benefit is clearly the Top 1% of the income distribution which exceeded the next highest Average Benefit ($327 received by the 80%-99% income group) by $77,139.
When we compare the bottom 40% of the income distribution with the top 40% we find that the bottom 40% received less than 1% ($0.1 billion) of the $95.5 billion of the Total Benefit from Capital Gains/Dividends while the top 40% received more than 99% ($98.2 billion) of these benefits, the difference being $98.1 billion. This difference was equivalent to 22% of the $444.3 billion the federal government spent on welfare in 2007.
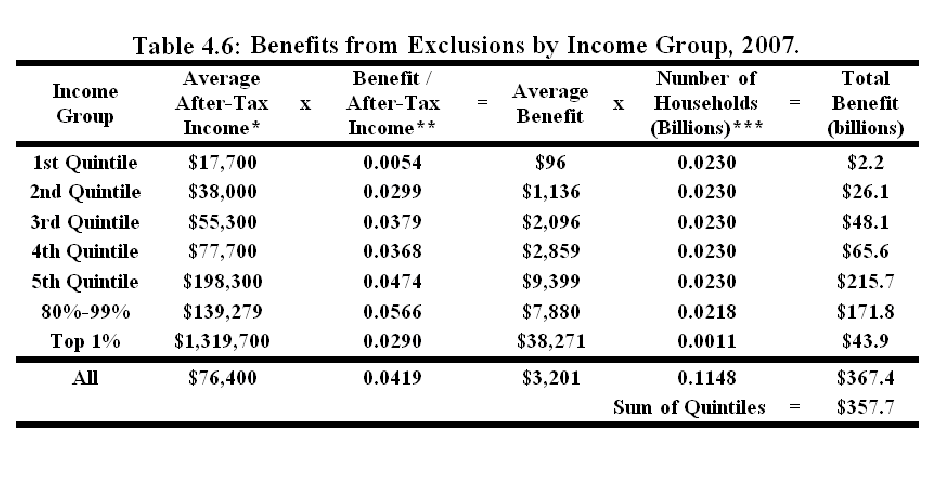
Exclusions
Exclusions refers to various forms of income (e.g., scholarships, fellowship grants, welfare benefits, employee fringe benefits, interest on municipal bonds, capital gains transferred at death) that are excluded from gross income. The average and total benefits received by each income group from Exclusions in 2007 that are implied by Table 4.3 are shown in Table 4.6.
Source: *Congressional Budget Office, **Burman et al., ***Census Bureau.
This table shows the way in which Exclusions, the largest category of tax expenditures, redistribute income from the general taxpayer to the various income groups within society. Here we find that only $2.2 billion of the $357.7 billion of Total Benefit from Exclusions (less than 1%) went to the poorest quintile (1st Quintile) with an Average Benefit of $96 while some $215.7 billion (60%) went to the richest quintile (5th Quintile) with an Average Benefit of $9,399. If we break down the richest quintile we find that 20% ($43.9 billion) of the $215.7 billion worth of Total Benefit that went to the top 20% of the income distribution, in fact, went to the Top 1% with an average benefit of $38,271.
The largest beneficiary of the Exclusions tax-expenditure entitlements in terms of Average Benefit is clearly the Top 1% of the income distribution which exceeded the next highest Average Benefit, $7,880 received by the top 80%-99%, by $30,391.
When we compare the bottom 40% (1st Quintile + 2nd Quintile) of the income distribution with top 40% (4th Quintile + 5th Quintile) we find that the bottom 40% received 8% ($28.3 billion) of the $357.7 billion of Total Benefit from Exclusions while the top 40% received more than 79% ($281.4 billion) of these benefits, the difference being $253.1 billion. This $253.1 billion difference was equivalent to 57% of the total of $444.3 billion the federal government spent on welfare in 2007.
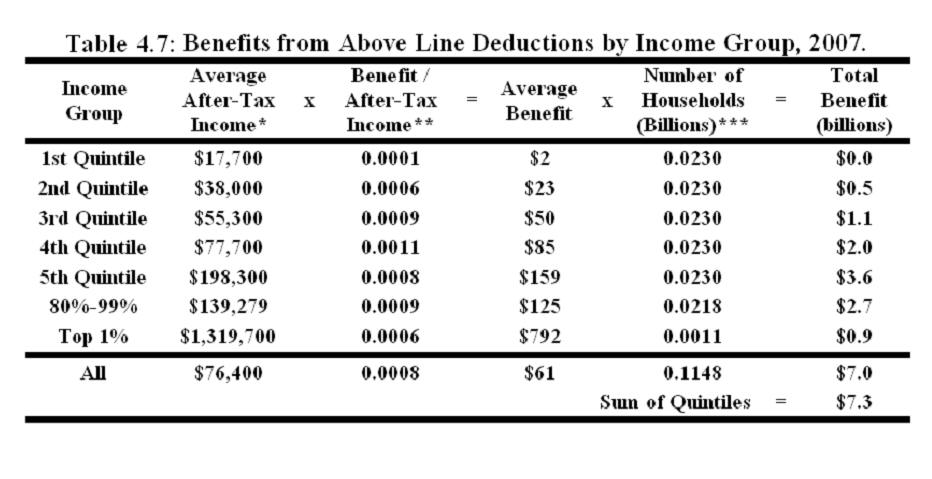
Above Line Deductions
Above-Line Deductions are deductions from gross income (e.g., Educator expenses, Moving expenses, and the IRA deduction) that taxpayers are allowed to take whether they choose to itemize their deductions or not. Above-Line Deductions are subtracted from gross income to arrive at Adjusted Gross Income. The average and total benefits received by each income group from Above-Line Deductions in 2007 are shown in Table 4.7.
Source: *Congressional Budget Office, **Burman et al., ***Census Bureau.
Above-Line Deductions is the smallest category of tax expenditures in Table 4.3 with only $7.3 billion worth of benefits in 2007. This tax-expenditure entitlement is relatively insignificant, both in terms of the federal budget and in terms of other tax expenditures. Here we find that virtually none of the $7.3 billion of Total Benefit from Above-Line Deductions went to the poorest quintile with an Average Benefit of only $2 while some $3.6 billion (50%) went to the richest quintile with an Average Benefit of $159. If we break down the richest quintile we find that 25% ($0.9 billion) of the $3.6 billion worth of Total Benefit that went to the top 20%, in fact, went to the Top 1% with an Average Benefit of $792.
When we compare the bottom 40% of the income distribution with the top 40% we find that the bottom 40% received less than 8% ($0.6 billion) of the $7.3 billion worth of Total Benefit from Above-Line Deductions while the top 40% received more than 76% ($5.6 billion) of these benefits, the difference being $5.0 billion. This $5.6 billion was less than 2% of the total amount the federal government spent on welfare in 2007.
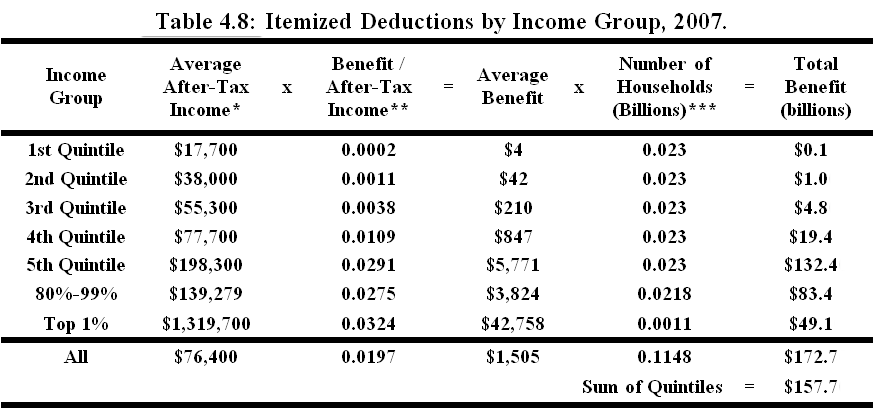
Itemized Deductions
Taxpayers can choose between subtracting a fixed Standard Deduction from their adjusted gross income in arriving at their taxable income or of listing separately (itemizing) the individual deductions (e.g., mortgage interest, state and local taxes, medical expenses, charitable contributions, investment interest and other investment and financial expenses) they may be eligible for. The average and total benefits received by each income group from Itemized Deductions in 2007 are shown in Table 4.8.
Source: *Congressional Budget Office, **Burman et al., ***Census Bureau.
Itemized Deductions is the second largest category of tax expenditures. Here we find that only $0.1 billion of the $157.7 billion of Total Benefit from Itemized Deductions (less than 1%) went to the poorest quintile with an Average Benefit of $4 while some $132.4 billion (84%) went to the richest quintile with an Average Benefit of $5,771. If we break down the richest quintile we find that 37% ($49.1 billion) of the $132.4 billion worth of Total Benefit that went to the top 20%, in fact, went to the Top 1% with an Average Benefit of $42,758.
The largest beneficiary of the Itemized Deductions tax-expenditure entitlement in terms of Average Benefit is clearly the Top 1% of the income distribution which exceeded the next highest Average Benefit, $3,824 received by the 80%-99% income group, by $38,934.
When we compare the bottom 40% of the income distribution with the top 40% we find that the bottom 40% received less than 1% ($1.0 billion) of the $157.7 billion of Total Benefit from Itemized Deductions while the top 40% received 96% ($151.9 billion) of these benefits, the difference being $150.8 billion. This $150.8 billion difference was equivalent to 34% of the $444.3 billion the federal government spent on welfare in 2007.
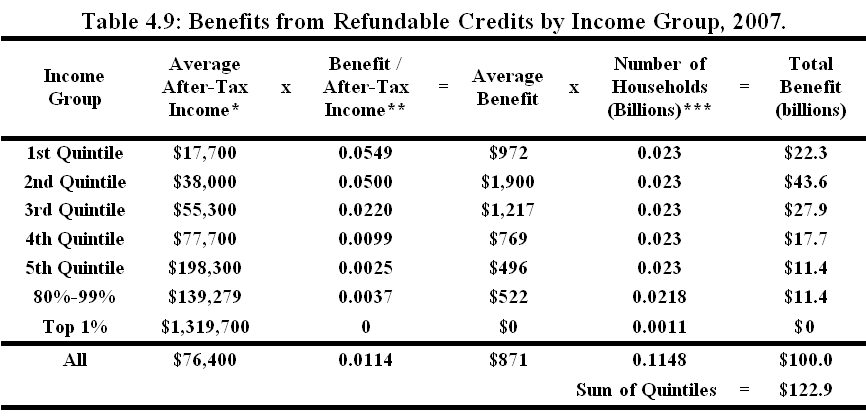
Refundable Credits
A tax credit (e.g., the Saver's Credit or Earned Income Tax Credit) is an amount that eligible taxpayers are allowed to subtract from their taxes owed, as determined by their taxable income and the applicable tax rates, in order to determine the amount of taxes they must actually pay. Refundable Credits (e.g., Earned Income Tax Credit and Child Tax Credit) are credits for which the taxpayer is entitled to the full amount of the credit whether the credit exceeds the amount of before-credit taxes owed or not. If the amount of a Refundable Credits exceeds the before-credit taxes owed, the taxpayer pays no tax, and the government must pay (refund) to the taxpayer the difference between the tax credit and the before-credit taxes owed. The average and total benefits received by each income group from Refundable Credits are shown in Table 4.9
Source: *Congressional Budget Office, **Burman et al., ***Census Bureau.
This table shows the way in which Refundable Credits, the fourth largest category of tax expenditures, redistributed income from the general taxpayer to the various income groups within society. Here we find that $22.3 billion of the $122.9 billion of the Total Benefit from Refundable Credits (18%) went to the poorest quintile with an Average Benefit of $972 while only $11.4 billion (9%) of the benefits of this tax expenditure went to the richest quintile with an Average Benefit of $496. If we break down the richest quintile we find that all of the $11.4 billion worth of Total Benefit that went to the top 20% of the income distribution went to the 80%-99% income group with an Average Benefit of $522. None went to the Top 1%.
The largest beneficiary of the Refundable Credits tax-expenditure entitlement in terms of Average Benefit is the 2nd Quintile of the income distribution with an Average Benefit of $1,900—almost twice the $972 benefit that went to the poorest quintile. At the same time, the 3rd Quintile also received a respectable share of the benefits from this tax-expenditure entitlement with an Average Benefit of $1,217, and the 4th Quintile and 80%-99% income group received an Average Benefit equal to 79% ($769) and 51% ($496), respectively, of the $972 Average Benefit received by the poorest quintile.
When we compare the bottom and top 40% of the income distribution we find that the bottom 40% received 54% ($65.9 billion) of the $122.9 billion of Total Benefit from Refundable Credits while the top 40% received only 24% ($29.0 billion) of these benefits, the difference being $36.9 billion. This $36.9 billion was equivalent to 8% of the $444.3 billion the federal government spent on welfare in 2007.[31]
Refundable Credits is the only category of tax expenditure that has the net effect of redistributing income from the general taxpayer to the bottom 40% of the income distribution.
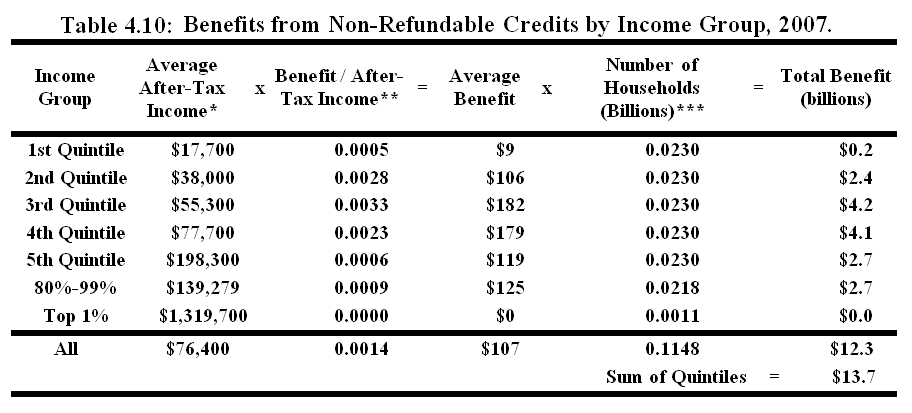
Non-Refundable Credits
Non-Refundable Credits (e.g., the Adoption Credit and Saver's Credit) are credits the taxpayer is entitled to only up to the amount of taxes owed. Unlike Refundable Credits, Non-Refundable Credits cannot reduce the after-credit taxes paid below zero. The average and total benefits received by each income group from Non-Refundable Credits are shown in Table 4.10.
Source: *Congressional Budget Office, **Burman et al., ***Census Bureau.
Non-Refundable Credits are the second smallest category of tax expenditures with only $13.7 billion in Total Benefit. This category is rather insignificant compared to the federal budget and the other categories of tax expenditures. Here we find that only $0.2 billion of the $13.7 billion of Total Benefit from Non-Refundable Credits (less than 2%) went to the poorest quintile with an Average Benefit of $9 while $2.7 billion (20%) went to the richest quintile with an Average Benefit of $119. If we break down the richest quintile we find that all of the $2.7 billion worth of Total Benefit that went to the top 20% of the income distribution went to the 80%-99% income group with an Average Benefit of $125. None went to the Top 1%.
The largest beneficiary of the Non-Refundable Credits tax-expenditure entitlement in terms of Average Benefit is the 3rd Quintile with an Average Benefit of $182, and the 4th Quintile ran a close second with an Average Benefit of $179. At the same time, the 2nd Quintile and 80%-99% income group received an Average Benefit equal to 58% ($106) and 69% ($125), respectively, of the $182 Average Benefit received by the 3rd Quintile.
When we compare the bottom 40% of the income distribution with the top 40% we find that the bottom 40% received 19% ($2.6 billion) of the $13.7 billion worth of Total Benefit from Non-Refundable Credits while the top 40% received 50% ($6.8 billion) of these benefits, the difference being $4.2 billion. This difference was equivalent to 1% of the $444.3 billion the federal government spent on welfare in 2007.
Endnotes
[24] The extent to which Other public assistance programs should be included in cash-payment or non-cash-welfare programs is not clear. This item is arbitrarily included in non-cash-payment programs for present purposes, but it is important to realize that these programs represented only 0.04% of the budget in 2013 and, thus, represent little more than rounding error in the numbers that follow or those that have been discussed above.
[25] This list is from the Section Notes of the Fiscal Year 2013 Historical Tables Budget of the U.S. Government.
[26] The average and total benefits received by each income group from Exclusions, Above-line deductions, Itemized Deductions, Refundable Credits, and Non-Refundable Credits are examined in the Appendix on Tax Expenditures at the end of this chapter. The benefits received by each income group from the special treatment of Capital Gains/Dividends and from all tax expenditures combined are examined in the next two sections.
[27] The Average Benefit in this table is obtained by multiplying the corresponding value for Total for each income group in Table 4.3 (i.e., the Benefit / After-Tax Income column in Table 4.4 is obtained from the line for Total in Table 4.3) by the Average After-Tax Income that is provided by the Congressional Budget Office for each income group. The Total Benefit in Table 4.4 is calculated by multiplying the number of households in each group as provided by the Census Bureau by the Average Benefit of each income group.
[28] The 80%-99% income group is not contained in Table 4.3, but the Total Benefit received by this income group is easily calculated by subtracting the Total Benefit received by the Top 1% from those received by the 5th Quintile. The Number of Households in this group is give by difference between the number of households in the 5th Quintile and Top 1%, and the Average Benefit is given by the ratio of Total Benefit and the Number of Households in this group. Since the average income of the 5th Quintile (Y5) is equal to the Total Income in this quintile divided by the Number of households in each quintile (N), the average income of this quintile is given by:
(1) Y5 = [Y19x(19/20)N + Y1x(N/20)] / N,
where Y19 and Y1 are the average incomes of the 80%-99% and Top 1% income groups, respectively. Thus, the Average Income of the 80%-99% income group is given by:
(2) Y19 = (Y5 - Y1/20) x (20/19).
It should also be noted that the Excel spreadsheet by which all of the calculations in this note have been made can be downloaded by clicking on this link.
[29] It is only fair to point out that if today’s 20% tax rate on capital gains and dividends had been applied in 2007, rather than the then current rate of 15%, the Average Benefit received by the Top 1% from Capital Gains/Dividends would have been only $58,100 and the Total Benefit would have been only $71 billion. That would have only been enough to fund Food Stamps, SSI, and 15% of TANF, and it would be only four times the $14,315 Average Benefit received from all tax expenditures by the 80%-90% income group in Table 4.4.
[30] It should be noted that the American Taxpayer Relief Act of 2012 (ATRA) increased the capital gains and dividend tax rates for upper income groups to 20%:
ATRA makes permanent the reduction in the preferential tax rate for long-term capital gains from 20 percent to 15 percent for those with non-gain taxable income less than the threshold for the top tax bracket. It also makes permanent the rate reduction from 10 percent to 0 percent for those with non-gain taxable income in the bottom two tax brackets. Thus, ATRA allows the tax rate on capital gains to revert to its pre-ATRA value of 20 percent for those taxpayers in the new top 39.6 percent tax bracket. ATRA also makes permanent the repeal of the 18 percent rate on gains from the sale of assets held for five or more years (8 percent for those in the bottom tax bracket). (Nunns)
[31] It should be noted that there is a bit of double counting here. The $122.9 billion of the Total Benefit from the Refundable Credits includes the refunded portion of this tax expenditure which amounted to over $54.5 billion in 2007. The refunded portion of this tax expenditure was an actual expenditure in the federal budget in 2007 and is included in the total of $441.1 billion the federal government spent on welfare in that year.