![]()
![]()
![]()
![]()
![]()
![]()
Understanding the Federal Budget
Prologue
This eBook is available in Kindle format at Amazon.com for a nominal contribution to this website.
We live in a country in which a large number of people, if not the vast majority, hold a set of beliefs about the federal budget that are demonstrably inconsistent with facts that exist in the real world. The extent to which this is so is easily seen by considering how many people would be surprised to discover that the size of the federal government as a fraction of our economy—that is, as a percent of gross domestic product (GDP)—in the 2000s was about where it was in the 1970s and was actually slightly smaller in 2000 and 2001 (17.6%) than it was in 1961 through 1964 (17.8%-18.2%). How many people would be shocked to discover that there were more federal government employees in 1967 (2.85 million, 6.3 million if we include the military) than there were in 2013 (2.77 million, approximately 4.3 million with the military)? How many would also be shocked to find that federal employees as a fraction of the civilian labor force has fallen by more than 50% since the 1960s? And how many know that Americans are one of the least-taxed people among the advanced countries in the world?
These are all simple and easily verifiable, real-world facts that most people would find almost impossible to believe given the deluge of disingenuous, antigovernment rhetoric that is designed to encourage us to believe otherwise.
Our Exploding Federal Budget
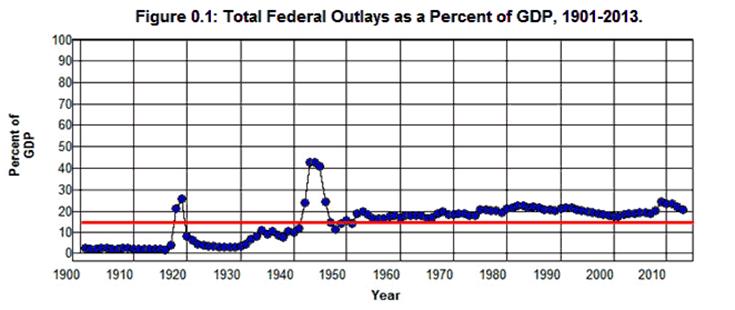
The fact that the size of the federal budget as a fraction of our economy in the 2000s was about where it was in the 1970s and was actually slightly smaller in 2000 and 2001 than it was in 1961 through 1964 is shown in Figure 0.1.
Source: Office of Management and Budget (1.1 10.1), Historical Statistics of the U.S. (Ca10).
This figure, which plots Total Federal Outlays as a Percent of GDP from 1901 through 2013, shows that in spite of what most people seem to believe:
The most significant increases in the federal government's role in the economy (Federal Outlays as a Percent of GDP) took place in the 1930s, 1940s, and 1950s.
This is what out exploding federal budget actually looks like in the real world.
Our Ever-Growing, Out-of-Control Federal Bureaucracy
Figure 0.2 shows the relationship between the number of Federal Government Employees—Total, Civilian, Military, and Postal—and the Civilian Labor Force and Population of the United States from 1950 through 2013.
Source: Bureau of Labor Statistics.
As is shown in this figure, the Total number of Federal Government Employees (Civilian plus Military) and federal Military employees fell substantially as the Vietnam War wound down and the Cold War came to an end. At the same time, the number of Civilian federal employees has remained relatively constant since 1967 (hovering around three million) in spite of the fact that the Civilian Labor Force has doubled since 1967 and the civilian Population increased by 90%. What's more, Figure 0.2 clearly shows that Civilian federal employees as a fraction of the workforce has been cut in half since the 1960s and by even more when we include Military employees. Civilian federal employees were 4.3% of the labor force in 1967; they were only 2.0% of the labor force in 2013, and it is worth noting that 20% of all Civilian federal employees worked for the Post Office in 2013 and delivered our mail!
This is what our ever-growing, out-of-control federal bureaucracy actually looks like in the real world.
Our Unbearable Tax Burden
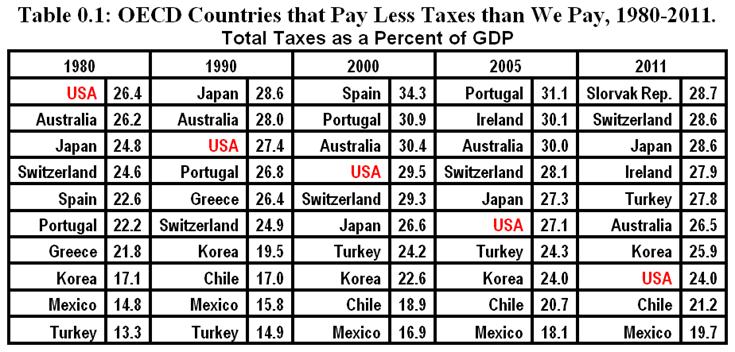
The fact that Americans are not terribly overtaxed is shown quite clearly in Table 0.1 which is constructed from the official statistics of the Organization for Economic Cooperation and Development (OECD). This table shows how the ranking of the United States among the 34 OECD countries has changed since 1980 in terms of the percentage of gross income (GDP) that is paid in taxes.
Source: Organization for Economic Cooperation and Development, (Comparative Tables).
We have moved from tenth from the bottom on this list to third from the bottom over the past thirty-one years. Among the advanced countries of the world, only Chile and Mexico paid less in taxes as a percent of their gross income than we did in 2011.
This is what our unbearable tax burden actually looks like in the real world.
The American Fiscal Dilemma
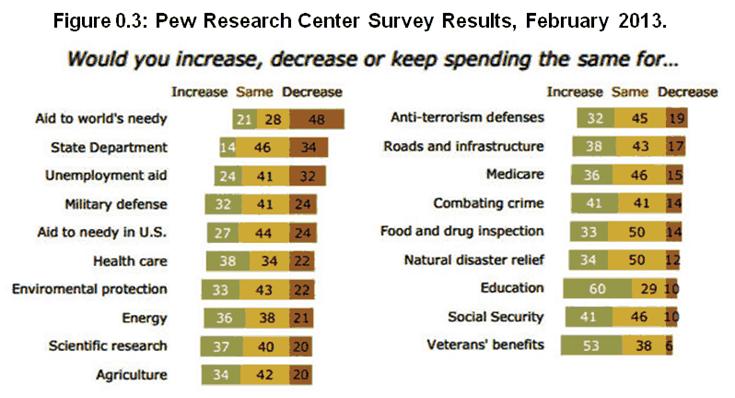
The ideas that the federal budget and federal employment have grown voraciously over the past fifty years and that Americans are terribly overtaxed are only three of the fiscal myths people believe today. In a recent survey (February 2013), the Pew Research Center asked 1,504 respondents: "If you were making up the budget for the federal government this year, would you increase spending, decrease spending or keep spending the same" for nineteen different categories of government expenditures. The expenditure categories and results of the survey are given in Figure 0.3.
Source: Pew Research Center
These results suggest that the vast majority of the American public is satisfied with the size of the federal government we have, and, if anything, would like to see it increase rather than decrease: For all categories of expenditures, other than the first three, a larger proportion of the respondents would choose to increase rather than decrease expenditures, and for all categories, even the first three, a majority of those who had an opinion would either increase expenditures or keep them the same. In addition, the three categories for which more respondents would rather decrease than increase—Aid to the world's needy, State Department, and Unemployment aid—sum to just 3% of the federal budget while just five of the categories which more respondents would increase rather than decrease—Social Security, Military defense, Medicare, Health care, and Aid to needy in U.S.—sum to over 70% of the federal budget.
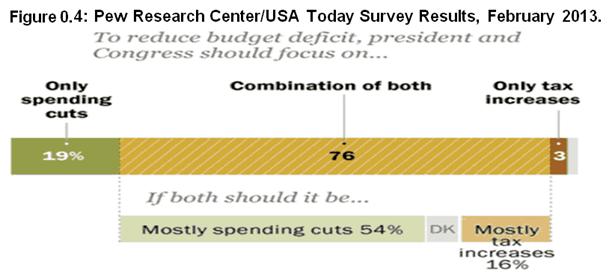
These results stand in stark contrast with those of the Pew Research Center/USA Today survey conducted later that same month. In this survey the respondents were asked if the president and Congress should focus on spending cuts, tax increases, or both in order to reduce the federal budget deficit. The results are given in Figure 0.4.
Source: Pew Research Center/USA Today
Here we find that the overwhelming majority of people (73%) would like to see the federal deficit problem solved through only or mostly spending cuts rather than through only or mostly tax increases (19%). In other words, an overwhelming majority of the American people would like to have their cake and eat it too; they want to increase the size of the federal government or keep it the same as they solve the deficit problem through only or mostly spending cuts.
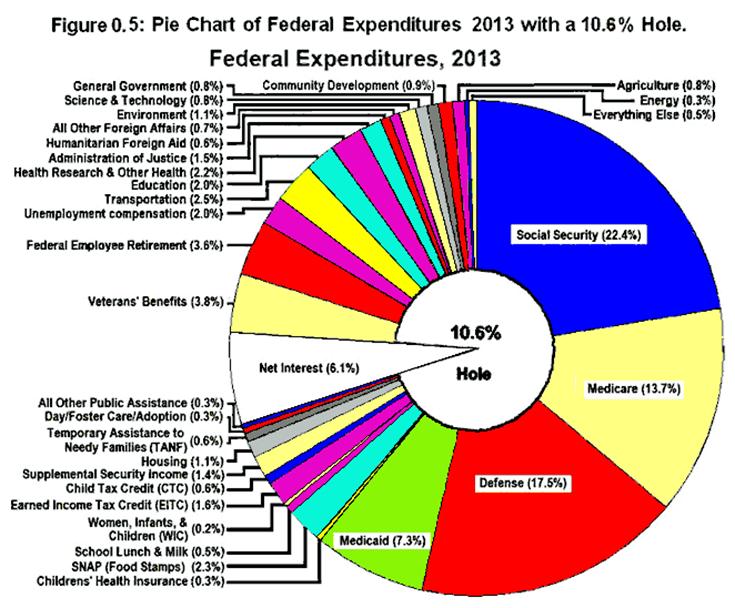
According to the Office of Management and Budget, the federal deficit was equal to 20% of total federal expenditures in 2013. As a result of rescinding some of the provisions of the 2001-2003 tax cuts combined with the expected recovery of the economy and some spending cuts, this deficit is estimated to decline to 10.6% of total federal expenditures by 2019. It should be obvious that we are not going to be able to eliminate the remaining 10.6% deficit through mostly spending cuts—as, apparently, 73% of the American people want to do—by cutting the 3% of the budget that goes to Aid to the world's needy, the State Department, or Unemployment aid. If we are to eliminate the 10.6% deficit estimated for 2019 through mostly spending cuts we are going to have to cut the 70% of the budget where we find Social Security, Military defense, Medicare, Health Care, and Aid to needy in U.S. because that's where the money is.
Figure 0.5 shows a breakdown of the federal budget with a 10.6% hole in it.
Source: Office of Management and Budget (3.2 11.3) [1]
Even a causal examination of this chart reveals that it is impossible to maintain the government the vast majority of the American people seem to want and, at the same time, reduce the deficit by as much as 10.6% through mostly spending cuts:
Where are these cuts supposed to come from?
Outline of this eBook
The purpose of this eBook is to explain the federal budget—both the actual numbers in the budget and the history of the budget—in order to clarify the actual, real-world choice faced by the American people in dealing with our fiscal problems.
Chapter 1: History of the National Debt begins with an explanation of the relationship between federal expenditures, revenues, deficits, and the national debt and why it is important to view these entities relative to the size of the economy. Particular attention is paid to the definitions and concepts that are needed to understand these relationships. The history of the national debt from 1916 to the present is then examined in detail. The appendix at the end of this chapter gives a brief explanation of some the ways we measure aggregate economic variables such as total output, the average price level, and productivity.
Chapter 2: History of the Federal Budget examines the history of the federal budget. All of the major expenditure and revenue components of the budget are plotted from 1940 through 2013. These plots show that even though the size of the federal budget relative to the economy has been fairly stable since World War II, the nature of the federal budget has changed dramatically: In the 1950s the budget was dominated by defense expenditures; today it is dominated by expenditures on social-insurance programs. These plots also show how the funding of the federal budget has changed as the importance of payroll taxes increased and that of corporate taxes decreased. The appendix at the end of this chapter lists all of the expenditures in the federal budget in 2013, broken down by function and subfunction, along with the percent of GDP and of the federal budget that each expenditure represented in that year.
Chapter 3: Human Resources and Social Insurance examines the growth of our federal social-insurance system since 1940. Federal expenditures on all of the major social-insurance programs are plotted from 1940 through 2013. These plots show how the retirement and medical social-insurance programs have come to dominate our federal social-insurance system. They also show that 1) federal retirement programs are dominated by Social Security, 2) federal medical programs are dominated by Medicare and Medicaid, and 3) only the medical portion of the federal social-insurance system has increased relative to the economy since the mid 1970s.
Chapter 4: Welfare, Tax Expenditures, and Redistribution examines the welfare component of our federal social-insurance system. Federal expenditures on each of the major welfare programs are plotted from 1940 through 2013, and the expenditures on each federal welfare program in 2013 are given along with the percent of GDP and of the federal budget that each program represented in that year. The increases in welfare expenditures that have occurred since the 1960s are seen to have been dominated by the increases in Medicaid and in the refundable tax credits that were instituted to encourage welfare recipients to work.
The nature of federal entitlement programs is also explained, and it is shown how we spend twice as much on our two largest entitlement programs—Social Security and Medicare—than on all of our welfare entitlement programs combined. Federal welfare expenditures in 2007 are then compared to the benefits from the federal tax-expenditure entitlement programs in that year. It is shown that the federal tax-expenditure entitlement programs (commonly referred to as tax breaks or loopholes) in 2007 had a much larger effect in redistributing income from the general taxpayer to the top of the income distribution than federal welfare programs had in redistributing income from the general taxpayer to the bottom, and it is argued that the special treatment of dividends and capital gains in the tax code is a far more lucrative entitlement program for the wealthy than any government program available to the poor.
Chapter 5: Summary and Conclusion explains why eliminating waste, fraud, and abuse in the federal budget cannot solve our deficit and debt problems. It is argued that if we are to solve these problems we must either a) raise taxes or b) make substantial cuts in defense and our federal retirement and medical programs, specifically, in Social Security and Medicare. The only alternative is to cut the rest of the budget which has already been cut by more than 50% since 1980. Attempting to solve our fiscal problems by cutting the rest of the budget will decimate our social safety net and make it impossible for the government to provide the essential services and benefits that only government can provide: a fair and just legal and criminal justice system; quality public education; effective public health programs; an effective and efficient personal healthcare system; efficient streets, roads, highways, and other forms of public transportation; a clean and safe environment; safe foods, drugs, and other consumer products; safe working conditions; and a stable, growing economy. These are the kinds of actual, real-world choices we must make if we are to solve the fiscal problems with which we are faced today.
Endnote
[1] Undistributed Offsetting Receipts and Commerce and Housing Credit are treated as revenues in constructing this chart rather than as negative expenditures as is done in the government accounting system. Thus, the various budget items in the Office of Management and Budget’s Table 3.2 are given as percentages of Total Outlays plus Undistributed Offsetting Receipts and Commerce and Housing Credit in Figure 0.5. As a result, the percentages are slightly less than the corresponding numbers when expressed as percentages of Total Outlays.