![]()
![]()
![]()
![]()
![]()
![]()
Understanding the Federal Budget
George H. Blackford © 8/27/2013
According to the OMB, the federal deficit was equal to 30% of total federal expenditures in 2012. As a result of rescinding some of the provisions of the 2001-2003 tax cuts combined with the expected recovery of the economy and some spending cuts, this deficit is estimated to decline to 10% of total federal expenditures by 2018.
The federal budget and the deficit has been at the center of the political debate in our country for the past forty years, yet, few people seem to understand how the money is spent. Many, if not most people seem to believe that somehow we can cut the budget dramatically, say by as much as 10%, and can thereby solve our long-run deficit problem without having to cut defense or Social Security or Medicare and without cutting those programs that make up our social safety net. (See www.rwEconomics.com) At the same time, there are those at the other end of the political spectrum who believe we can save a tremendous amount in taxes by cutting defense. What do we find when we look at the actual numbers that exist in the real world?
Breakdown of the Federal Budget
Figure 1 is constructed from the OMB's Table 3.1—Outlays by Superfunction and Function. This figure plots a breakdown of the actual, real-world expenditures of the federal government in terms of its three largest categories (Superfunctions) from 1940 through 2012: Defense, Human Resources, and Net Interest.
Figure 1: Defense, Human Resources, and Net Interest, 1940-2012.
Source: Office of Management and Budget. (3.1)
The first thing we see when we look at the graphs in this figure is that even though the size of the federal budget has changed very little relative to the economy since the 1950s, the Human Resources component of the budget—those programs that make up our social insurance system including Social Security, Medicare, and those programs that make up our social safety net—has grown dramatically. It has gone from less than 20% of the budget in the early 1950s to more than 60% in the 2000s.
At the same time, we see that Defense has decreased just as dramatically, going from over 60% of the budget in the early 1950s to around 20% in the 2000s. Meanwhile the third largest category in the budget, Net Interest, has gone from a high of 13.8% of the budget in 1948 to a low of 5.2% in 2009, and it stood at 8.4% of the budget in 2007—the year before the federal budget was distorted by the financial panic in 2008 and the economic crisis that followed. What is most relevant to the point at hand, however, is what has happened to All Other Expenditures and Defense.
All Other Outlays
All Other Expenditures is constructed by subtracting the sum of Defense, Human Resources, and Net Interest from the Total Expenditures (Total outlays less Undistributed offsetting receipts in OMB's Table 3.1). This variable shows us how much the federal government spent on everything other than Defense, Human Resources, and Net Interest. All Other Expenditures consists of such things as expenditures on Energy, Natural Resources and Environment, Transportation, Community and Regional Development, International Affairs, General Science, Space, Technology, Agriculture, Administration of Justice, and General Government. This residual has gone from a high of 31.6% of the budget in 1940 to a low of 7.4% in 2010. It stood at 9.4% in 2007 before the financial and economic crisis that wrought havoc with the federal budget began and at 10.8% in 2012.
It is obvious—or at least it should be obvious to anyone who looks at the actual, real-world expenditures of the federal government plotted in Figure 1—that there is no reason to believe we can save a substantial amount in taxes by cutting the programs in the All Other Expenditures category in Figure 1, obviously not enough to reduce the total budget by 10%. The expenditures on programs in this category have already been cut by almost 50% since 1980, relative to the budget and GDP, and even if we were to eliminate all of these expenditures completely—which, of course, we cannot do and still have a functioning government—we would succeed in reducing the size of the federal budget by at most 11%.
What do we find when we look at Defense?
Defense
It is apparent from Figure 1 that there may be room to make additional cuts in the area of Defense. After all, Defense today is barely below where it stood in 1980 when we were still waging the Cold War against the Soviet Union, and with the end of the wars in Iraq and Afghanistan there should be room to maneuver here. Just the same, there is no reason to think we can cut our total tax bill by as much as 10% simply by cutting Defense. Even if we were to cut the defense budget in half—something that virtually no one would be willing to do—it would only reduce the total federal budget by about 10%.
Thus, if we are serious about saving as much as 10% of our total federal taxes, unless we are willing to make draconian cuts in Defense or dismantle a substantial portion of rest of the federal government, we must look to Human Resources. That's where the money is, and that's also where Social Security and Medicare are as well as the other social-insurance programs that make up our social safety net. The question is:
Does it really make sense in the real world to think we can save a lot of money by cutting Human Resources without cutting Social Security or Medicare and without cutting the programs that make up our social safety net?
What do we find when we look at the actual numbers that exist in the real world as to how the money allocated to Human Resources is spent?
Human Resources
The OMB's Table 11.3—Outlays for Payments for Individuals details the bulk of the expenditures contained in the Human Resources category of the budget. Figure 2 breaks down the items in Table 11.3 into four categories: Retirement/Disability is the sum of all federal expenditures on retirement and disability programs. Healthcare is the sum of all federal expenditures on healthcare. Other Payments for Individuals is the sum of all federal expenditures on all payments-for-individual programs that are not medical or retirement/disability programs. The final category, Other Human Resources, is the total of all government expenditures on all other Human Resources programs. Each of these categories is explained in detail below.
Figure 2: Breakdown of Human Resources, 1940-2012.
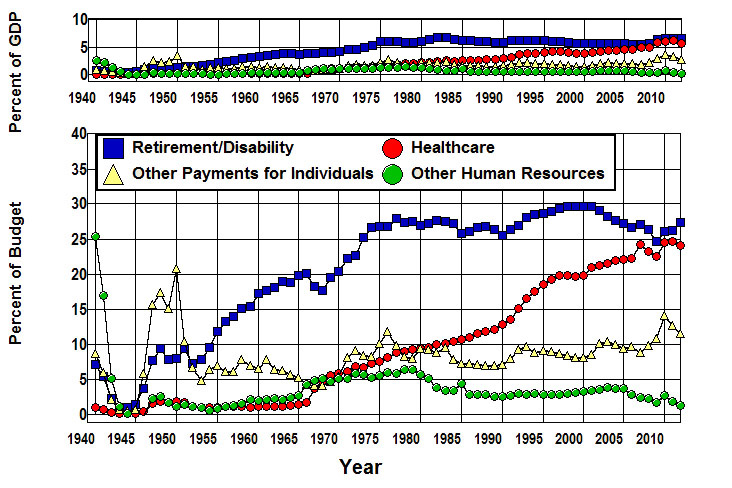
Source: Office of Management and Budget. (11.3 3.1 10.1)
The first thing we see when we look at the breakdown in Human Resources in Figure 6 is that Retirement/ Disability has been the largest component of Human Resources since 1952.
The second is that while there were significant increases from 1965 through 1975 in all four of the graphs in this figure, only Healthcare has continued to rise after 1975. This component of the federal budget has grown almost continuously from virtually nothing in 1965 to the point where it rivals Retirement/Disability as the largest component of Human Resources today.
Retirement/Disability and Healthcare combined dominate Human Resources and accounted for some 82% of all Human Resources expenditures in 2007 and 80% in 2012. (See Appendix.) This would suggest that if we are to find ways to make substantial cuts in Human Resources we should begin by looking at Retirement/Disability and Healthcare. Before we do this, however, it is worth emphasizing the following point:
When we examine Figure 1 and Figure 2 together it becomes obvious that the only part of the federal government that has grown dramatically since 1975 is expenditures on Healthcare.
Retirement/Disability
Table 1 shows all of the federal programs listed in OMB's Table 11.3 that are included in Retirement/Disability in Figure 1 along with the amount spent on each program in 2007, the percent of GDP it consumed in that year, and the percent of the federal budget it consumed as well. (See Appendix for 2012.)
Table 1: Expenditures Included in Retirement/Disability.
|
Program 2007 |
Billions of Dollars |
Percent of Budget |
Percent of GDP |
|
483.3 |
17.71 |
3.49 |
|
|
97.5 |
3.57 |
0.70 |
|
|
5.8 |
0.21 |
0.04 |
|
|
43.5 |
1.59 |
0.31 |
|
|
60.9 |
2.23 |
0.44 |
|
|
31.1 |
1.14 |
0.22 |
|
|
2.6 |
0.10 |
0.02 |
|
|
32.9 |
1.21 |
0.24 |
|
|
3.4 |
0.12 |
0.02 |
|
|
Total Retirement and Disability |
761.0 |
27.88 |
5.49 |
Source: Office of Management and Budget. (11.3 3.1 10.1)
It is clear from this table that Retirement/Disability is dominated by Social Security in that fully 76% of the total spent on programs in this category of the budget went to Social Security in 2007 while 19% went to to civil service, military, and railroad retirement/disability programs, and only 4% to the Supplemental Security Income (SSI) program. .
It is equally clear from this table that there is no way to make substantial cuts in this portion of the Human Resources budget without cutting Social Security. After all, military, civil servants, railroad employees, and other government employees are just as entitled to their retirement/disability benefits as are Social Security recipients, and, in any event, these programs took up less than 6% of the total budget.
This leaves the SSI program which was only 4% of Human Resource expenditures in 2007 and 1.2% of the entire federal budget. Aside from the fact that SSI was only 1.2% of the budget in 2007 and 0.24% of our gross income, SSI is the primary social safety-net program that provides for indigent disabled and indigent elderly individuals who are either not eligible for Social Security or whose benefits fall below a subsistence level. Substantial cuts in this program would not only save virtually nothing, it would also tear a hole in our social safety net.
What about Healthcare?
Healthcare
Table 2 shows all of the federal programs listed in Table 11.3 that are included in Healthcare along with the amount spent on each in 2007, the percent of GDP it consumed in that year, and the percent of the federal budget it consumed.
Table 2: Expenditures Included in Healthcare.
|
Program 2007 |
Billions of Dollars |
Percent of Budget |
Percent of GDP |
|
204.9 |
7.51 |
1.48 |
|
|
230.1 |
8.43 |
1.66 |
|
|
6.0 |
0.22 |
0.04 |
|
|
190.6 |
6.98 |
1.38 |
|
|
3.3 |
0.12 |
0.02 |
|
|
30.5 |
1.12 |
0.22 |
|
|
5.9 |
0.22 |
0.04 |
|
|
3.2 |
0.12 |
0.02 |
|
|
7.6 |
0.28 |
0.05 |
|
|
Other |
0.3 |
0.01 |
0.00 |
|
Total Medical care: |
682.4 |
25.00 |
4.92 |
Source: Office of Management and Budget. (11.3 3.1 10.1)
Here we are looking at 25% of the budget, and it is clear from this table that Medicare and Medicaid dominate Healthcare in that these two programs accounted for over 90% of Healthcare expenditures in 2007 with Medicare accounting for 70% of this 90%. What about the 30% of this 90% that went to Medicaid?
This program represented 7% of the federal budget and 1.4% of our gross income in 2007 and lies at the very core of our social safety net. According to the Census Bureau's Table 151. Medicaid—Beneficiaries and Payments: 2000 to 2009, some 75% of its beneficiaries were either poor Children, indigent Blind/Disabled individuals, or indigent elderly adults age 65 and over, and over 85% of Medicaid's expenditures went to these individuals. It would appear that there is very little room to cut this 7% of the budget without causing a great deal of hardship and misery through the denial of medical services to poor children or indigent disabled/elderly adults.
That leaves the remaining 10% of the Human Resources budget that went to the other Healthcare programs in Table 2. Here we are talking about 2% of the entire federal budget and 0.4% of our gross income. Of that 2%, 67.2% went to veterans (Hospital and medical care for veterans and Uniformed Services retiree health care fund), 10.6% to Children's health insurance, and 5.8% went to Indian health. Of the remaining 16.6%, 63.1% went to Health resources and services (a program that is designed to meet the healthcare needs in underserved, mostly rural areas), 34.0% went to Substance abuse and mental health services (a program that is severely underfunded given the extent of the substance abuse problem in our country), and 2.9% went to Other federal healthcare programs.
Veterans certainly have as much right to their medical benefits as Medicare recipients, and the rest of these programs play an important role in our social safety net. In addition, since the rest of these programs took up only 0.68% of the entire federal budget in 2007 and 0.13% of our gross income there is virtually nothing to be saved in taxes by eliminating these programs.
The leaves but two categories in Figure 1 to examine: Other Payments for Individuals and Other Human Resources.
Other Payments for Individuals
Other Payments for Individuals includes the expenditures on all of the federal programs in Table 11.3 that are not medical or retirement/disability programs. The items included in this category along with the amount spent on each in 2007, the percent of GDP it consumed in that year, and the percent of the federal budget it consumed are given in Table 3.
Table 3: Non-Medical/Retirement/Disability Programs.
|
Program 2007 |
Billions of Dollars |
Percent of Budget |
Percent of GDP |
|
33.2 |
1.22 |
0.24 |
|
|
3.4 |
0.13 |
0.02 |
|
|
27.5 |
1.01 |
0.20 |
|
|
33.0 |
1.21 |
0.24 |
|
|
34.9 |
1.28 |
0.25 |
|
|
Child nutrition and special milk programs |
13.0 |
0.48 |
0.09 |
|
Supplemental feeding programs (WIC and CSFP) |
5.3 |
0.19 |
0.04 |
|
1.1 |
0.04 |
0.01 |
|
|
21.1 |
0.77 |
0.15 |
|
|
2.5 |
0.09 |
0.02 |
|
|
38.3 |
1.40 |
0.28 |
|
|
5.1 |
0.19 |
0.04 |
|
|
6.6 |
0.24 |
0.05 |
|
|
16.2 |
0.59 |
0.12 |
|
|
0.4 |
0.01 |
0.00 |
|
|
0.6 |
0.02 |
0.00 |
|
|
1.3 |
0.05 |
0.01 |
|
|
1.4 |
0.05 |
0.01 |
|
|
1.0 |
0.03 |
0.01 |
|
|
1.3 |
0.05 |
0.01 |
|
|
247.2 |
9.06 |
1.78 |
Source: Office of Management and Budget. (11.3 3.1 10.1)
The first thing that jumps out from this table is that, in spite of the abundance of programs, we are talking about only slightly more than 9% of the entire federal budget here and less than 2% of our gross income. While there were no programs that dominated this category, the ten largest items in Table 3 are arranged from largest to smallest and listed in Table 4. These ten items accounted for 93% of the total expenditures in the Other Payments for Individuals category in 2007.
Table 4: Ten Largest Items in Other Payments for Individuals.
|
Program 2007 |
Billions of Dollars |
Percent of Budget |
Percent of GDP |
|
38.3 |
1.40 |
0.28 |
|
|
34.9 |
1.28 |
0.25 |
|
|
33.2 |
1.22 |
0.24 |
|
|
33.0 |
1.21 |
0.24 |
|
|
27.5 |
1.01 |
0.20 |
|
|
21.1 |
0.77 |
0.15 |
|
|
16.2 |
0.59 |
0.12 |
|
|
Child nutrition and special milk programs |
13.0 |
0.48 |
0.09 |
|
6.6 |
0.24 |
0.05 |
|
|
Supplemental feeding programs (WIC and CSFP) |
5.3 |
0.19 |
0.04 |
|
Sum of Top Ten |
229.1 |
8.4 |
1.7 |
|
Percent of Other Payments for Individuals |
92.7 |
92.66 |
92.66 |
The ten programs listed in Table 4 are the backbone of our social safety net. We're talking about the Earned Income and Child Tax Credits (1.99% of the total budget in 2007 / 2.17% in 2012) that are designed to encourage work and assist the working poor who pay over 14% of their earned income in payroll taxes—a larger percentage than Romney paid in total taxes on tens of millions in unearned income. About food stamps, school lunch and milk programs, and feeding programs for women, infants, and children (1.95%/ 2.98%) that assist the poor in feeding themselves and their children. About student aid (1.01% / 1.39%) and unemployment compensation (1.22% / 2.61%). About foster care and adoption assistance (0.24% / 0.19). And we're talking about only 9% of the federal budget in all of the programs in Other Payments for Individuals combined and less than 2% of our gross income in 2007 and 13% of the federal budget and 3% of GDP in 2012 in the midst of the worse economic crisis since the Great Depression.
There is no reason to think that we can save a great deal in taxes by making substantial cuts in this portion of the budget without dismantling our social safety net and causing a great deal of hardship and misery. The money just isn't in this 9% or 12% of the budget, and it's through the programs in this portion of the budget—combined with Medicaid and SSI—that our war against hardship and misery is waged.
Other Human Resources
This leaves only Other Human Resources in which to find those elusive programs on which the government is supposedly squandering our federal tax dollars. Other Human Resources is the total of government expenditures on all Human Resources programs that are not included in the other categories in Figure 2. It is calculated by subtracting the sum of Retirement/Disability, Healthcare, and Other Payments for Individuals in Figure 2 from the total of Human Resources given in Figure 1. This residual can be disposed of rather quickly. It represented only 2.8% of the budget in 2007 and less than 1% of our gross income, and aside from the fact that 2.8% of the budget is insignificant in the grand scheme of things, as is shown in Figure 2, the programs contained in Other Human Resources have already been cut by almost 50% since 1980. There is no reason to believe that additional savings can be found in this 2.8% of the budget.
Summary and Conclusion
In searching for ways to cut the federal budget it is important to understand that cutting a small amount from a large portion of the budget or a large amount from a small portion of the budget may yield a lot of money in absolute terms, but it doesn't yield a lot of money relative to the size of the total budget. It only reduces the total budget by a small amount. To reduce the total budget by a large amount we have to cut a large amount from a large portion of the budget. That's just grade school arithmetic. (It is also important to understand that we are not going to be able to cut the budget by eliminating waste, fraud, and abuse. See Waste, Fraud, and Abuse in the Federal Budget.)
When we look at the actual expenditures in the federal budget over the past forty years we find that it is not possible to cut a large amount from a large portion of the budget without cutting defense, Social Security, Medicare, or the programs that make up our social safety net because that's where the money is. The rest of the budget has already been cut to the bone since 1980, and there simply isn't enough money in the rest of the budget to make a difference even if we cut a large amount from this small portion of the budget.
It is also worth noting that personal income in the United States amounted to $13,191.3 billion in 2011, and the total federal expenditures came to $3,603 billion. This means that all we can save by cutting the federal budget by 10% is a reduction in our tax liability by an amount equal to 2.73% of our personal income.
This is the choice our long-term deficit problem poses: We must either make substantial cuts in Defense, Social Security, Medicare, and those programs that make up our social safety net, or we must increase taxes by 3% or our personal income. We cannot solve our long-term deficit problem and, at the same time, maintain our current levels of expenditures on these government programs unless we increase taxes.
Appendix: Payments for Individuals in 2012
The following table gives the expenditures in the Office of Management and Budget’s Table 11.3—Outlays for Payments for Individuals in 2012 for each program along with the percent of GDP and of the federal budget that each program represented in that year.
Table 5: OMB's Outlays for Payments for Individuals, 2012.
|
Program 2012 |
Billions of Dollars |
Percent of Budget |
Percent of GDP |
|
773.8 |
21.87 |
4.98 |
|
|
631.4 |
17.85 |
4.06 |
|
|
135.7 |
3.84 |
0.87 |
|
|
6.7 |
0.19 |
0.04 |
|
|
175.8 |
4.97 |
1.13 |
|
|
48.8 |
1.38 |
0.31 |
|
|
73.9 |
2.09 |
0.48 |
|
|
50.1 |
1.41 |
0.32 |
|
|
3.1 |
0.09 |
0.02 |
|
|
92.3 |
2.61 |
0.59 |
|
|
879.5 |
24.86 |
5.66 |
|
|
261.6 |
7.39 |
1.68 |
|
|
288.2 |
8.14 |
1.85 |
|
|
9.1 |
0.26 |
0.06 |
|
|
250.5 |
7.08 |
1.61 |
|
|
4.5 |
0.13 |
0.03 |
|
|
41.7 |
1.18 |
0.27 |
|
|
7.8 |
0.22 |
0.05 |
|
|
3.0 |
0.09 |
0.02 |
|
|
8.7 |
0.25 |
0.06 |
|
|
0.2 |
0.01 |
0.00 |
|
|
1.5 |
0.04 |
0.01 |
|
|
1.9 |
0.05 |
0.01 |
|
|
0.9 |
0.03 |
0.01 |
|
|
59.8 |
1.69 |
0.38 |
|
|
10.7 |
0.30 |
0.07 |
|
|
49.1 |
1.39 |
0.32 |
|
|
40.0 |
1.13 |
0.26 |
|
|
106.7 |
3.02 |
0.69 |
|
|
80.4 |
2.27 |
0.52 |
|
|
Child nutrition and special milk programs |
18.3 |
0.52 |
0.12 |
|
Supplemental feeding programs (WIC and CSFP) |
6.8 |
0.19 |
0.04 |
|
1.2 |
0.03 |
0.01 |
|
|
163.8 |
4.63 |
1.05 |
|
|
44.2 |
1.25 |
0.28 |
|
|
20.1 |
0.57 |
0.13 |
|
|
3.8 |
0.11 |
0.02 |
|
|
54.9 |
1.55 |
0.35 |
|
|
5.0 |
0.14 |
0.03 |
|
|
4.5 |
0.13 |
0.03 |
|
|
6.8 |
0.19 |
0.04 |
|
|
22.1 |
0.62 |
0.14 |
|
|
0.2 |
0.01 |
0.00 |
|
|
2.1 |
0.06 |
0.01 |
|
|
6.0 |
0.17 |
0.04 |
|
|
0.4 |
0.01 |
0.00 |
|
|
1.2 |
0.04 |
0.01 |
|
|
1.5 |
0.04 |
0.01 |
|
|
1.2 |
0.03 |
0.01 |
|
|
1.7 |
0.05 |
0.01 |
|
|
2,297.7 |
64.95 |
14.78 |
Source: Office of Management and Budget (11.3 3.1 10.1)